The Manila Observatory
is a private non-stock, non-profit, scientific research institution established in 1865 by the Jesuit mission in the Philippines. With Federico Faura at its inception, it was engaged in the systematic observation of Philippine weather.
READ MORE
The Manila Observatory
is a private non-stock, non-profit, scientific research institution established in 1865 by the Jesuit mission in the Philippines. With Federico Faura at its inception, it was engaged in the systematic observation of Philippine weather.
READ MORE
The Manila Observatory
is a private non-stock, non-profit, scientific research institution established in 1865 by the Jesuit mission in the Philippines. With Federico Faura at its inception, it was engaged in the systematic observation of Philippine weather.
READ MORE

The Manila Observatory
is a private non-stock, non-profit, scientific research institution established in 1865 by the Jesuit mission in the Philippines. With Federico Faura at its inception, it was engaged in the systematic observation of Philippine weather.
READ MORE
The Manila Observatory
is a private non-stock, non-profit, scientific research institution established in 1865 by the Jesuit mission in the Philippines. With Federico Faura at its inception, it was engaged in the systematic observation of Philippine weather.
READ MORE
The Manila Observatory
is a private non-stock, non-profit, scientific research institution established in 1865 by the Jesuit mission in the Philippines. With Federico Faura at its inception, it was engaged in the systematic observation of Philippine weather.
READ MORE
- Manila Observatory at CRS PH Urban Resilience Conference
- Sustainable Energy Transition Roadmap Executive Summary
- MO, GDI, Perform Scoping Activity in Cebu, Palawan for Powering a Just Energy Transition Green Minerals Challenge
- New Year 2024 Particle Pollution Measurements in Metro Manila and Other Local Urbanized Areas
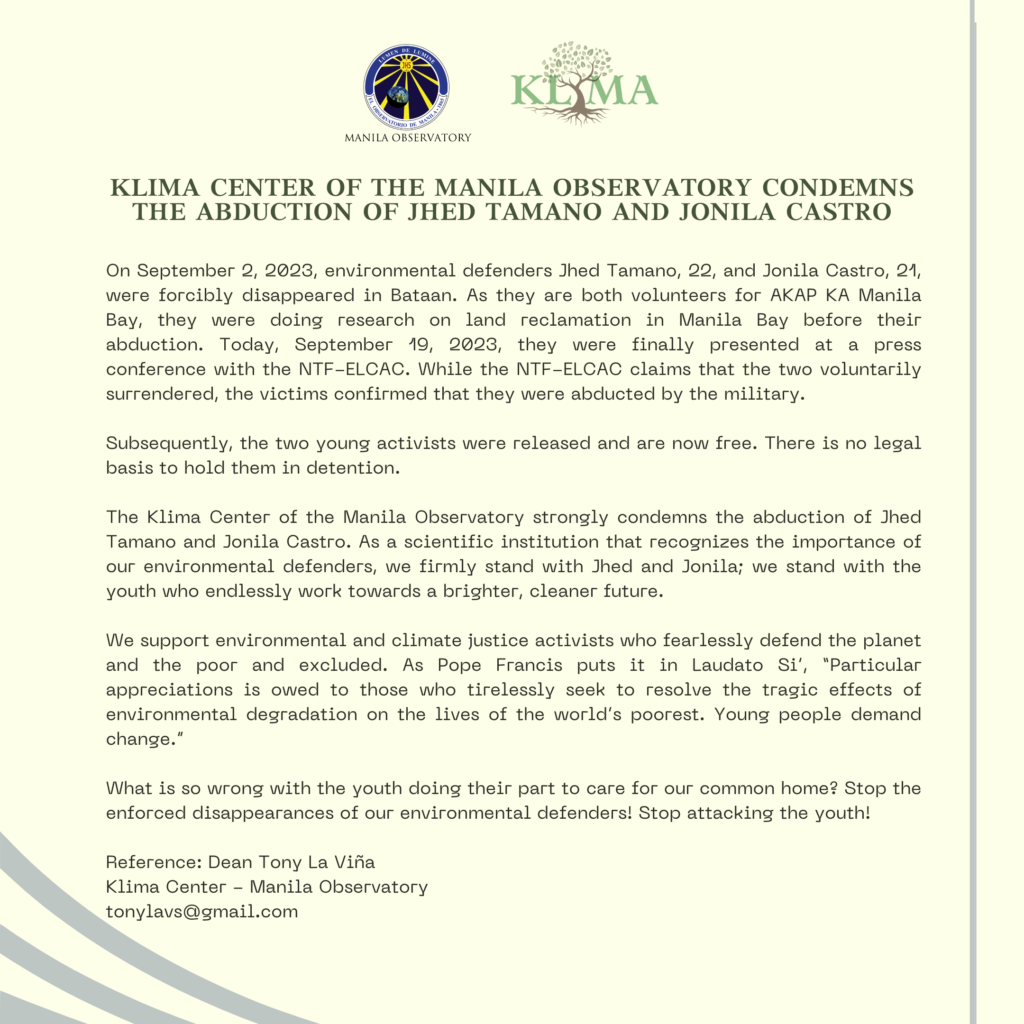
- Klima Center of the Manila Observatory Condemns the Abduction of Jhed Tamano and Jonila Castro
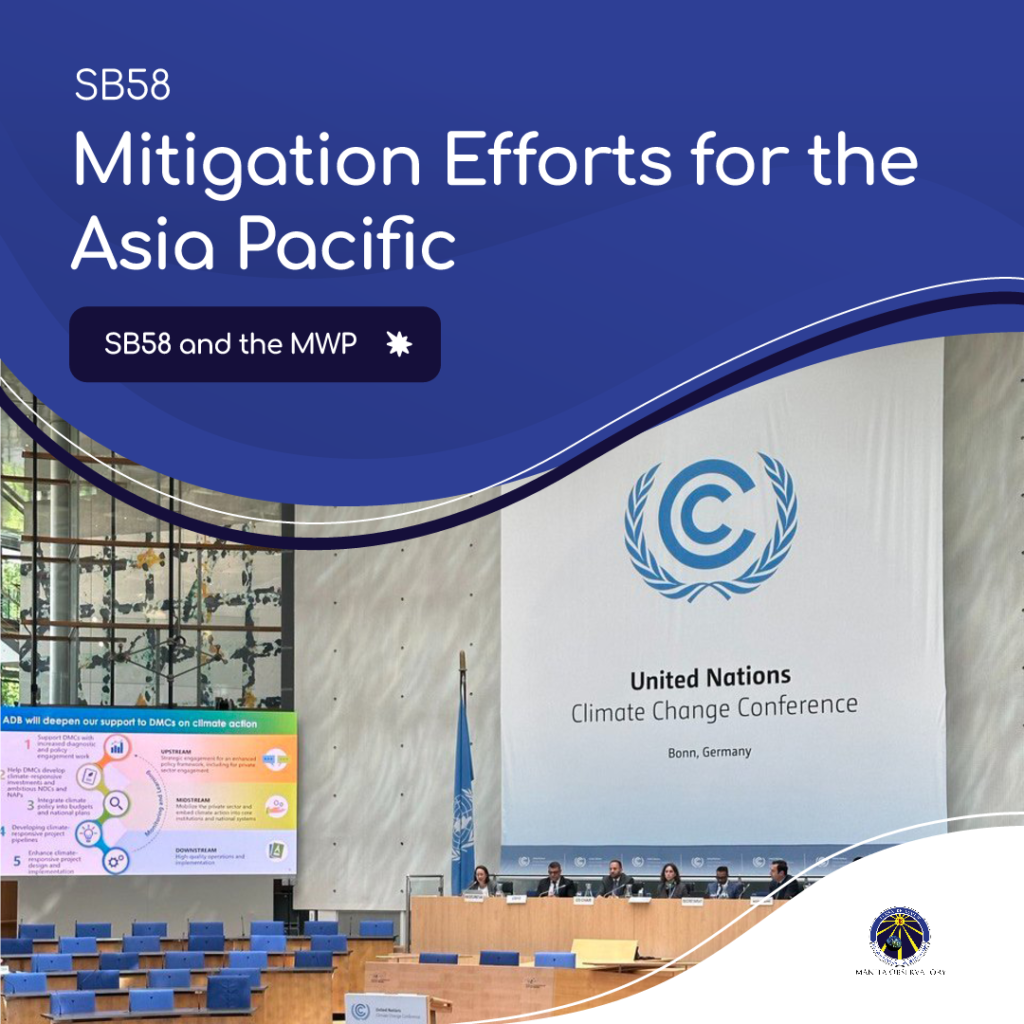
- Accelerating Mitigation Efforts in the Asia Pacific: SB58
- Back at Bonn Climate Change Conference, yet What’s New?
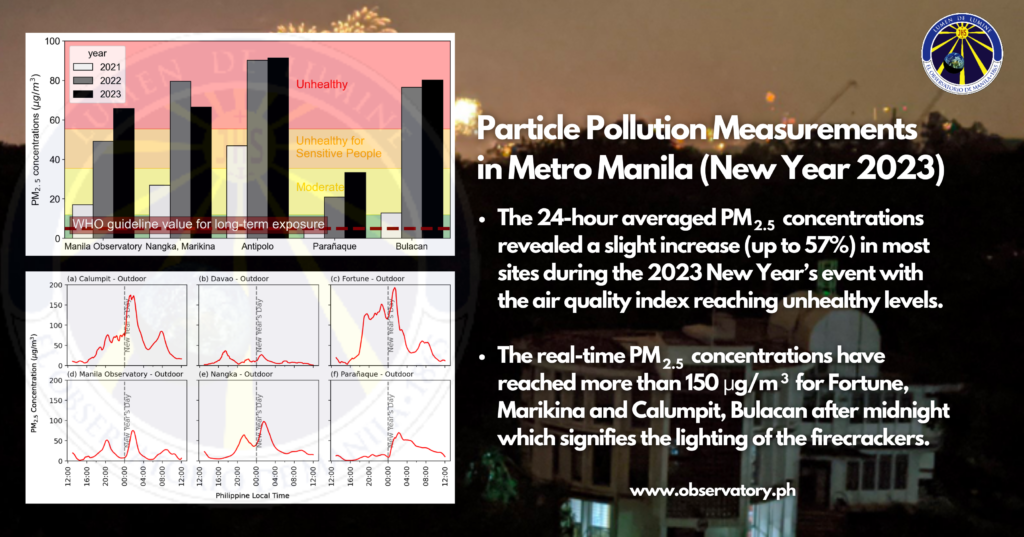
- Particle Pollution Measurements in Metro Manila (New Year 2023)