by Mariane Desiree Avendaño, Zenn Marie Cainglet, Aubrey May De Francisca, Paola Banaga, Melliza Templonuevo Cruz, James B. Simpas, Maria Obiminda Cambaliza, Fr. Jose Ramon Villarin, SJ, and Fr. Daniel McNamara, SJ
Summary
Government policies and annual campaigns by the Department of Health and Philippine National Police against firecrackers have been effective in restricting the use of pyrotechnic devices during New Year celebrations and consequently decreasing the values of PM2.5 concentrations in various sites. This is evident in the large decrease in average PM2.5 concentrations between data for 2005-2014 and for 2015-2024. The total ban of firecrackers in 2020 and stricter regulations implemented in local government units in subsequent years due to the COVID-19 pandemic resulted in particularly lower concentrations in the previous four years. However, with most mobility bans being lifted in 2024, there is a perceptible increase between 2023 and 2024. In particular, Calumpit, Bulacan; Nangka, Marikina; and Katipunan, Quezon City had 65%, 53%, and 20% increases respectively. During New Year celebrations, significant spikes in PM2.5 concentrations are detected within an hour of midnight at most sampling sites, primarily due to nearby firework explosions and motor vehicular emissions. These elevated PM2.5 concentrations persist for up to six hours before and after midnight because low wind speed and the absence of precipitation result in the particles’ poor dispersion. The highest PM2.5 concentrations for this year’s celebrations were observed in San Jose Del Monte, Bulacan; Nangka, Marikina City; and Antipolo, Rizal. The comparison of indoor and outdoor PM2.5 concentrations in Nangka, Marikina also shows a lag between the peaks of PM2.5 concentrations influenced by infiltration and ventilation rates. Alarmingly, even in the absence of indoor human activities that may emit PM2.5, indoor concentrations reached hazardous levels that can be attributed to poor ventilation.
Fireworks and pyrotechnic displays are popular sources of entertainment during grand personal, cultural, and social celebrations. Among these festivities, New Year celebrations are the most well known for such prominent presentations. In the past five years, however, the government has imposed various regulations on the use of pyrotechnic devices that have limited its access and use to regular citizens (Official Gazette, 2017; Servallos, 2020; Felipe, 2022).
In 2017, former president Rodrigo Duterte issued Executive Order No. 28, “Providing for the Regulation and Control of the Use of Firecrackers and Other Pyrotechnic Devices,” which limited the use of such devices to community firework displays to minimize the risk of injuries. This order bans the conduct of firework displays without the presence of licensed individuals by the Philippine National Police (PNP) or in places of residences (Official Gazette, 2017). At the height of the pandemic in 2020, the Department of the Interior and Local Government (DILG) stressed the prohibition of staging firework displays in all households to prevent mass gatherings, pyrotechnic-related injuries, and the spread of COVID-19 (Ranada, 2020). Some local government units (LGUs), such as Valenzuela, Parañaque, and Navotas, imposed total bans on the use and sale of firecrackers while others, such as Marikina, canceled even the city-based annual firework displays (Servallos, 2020). Such guidelines were credited by the Department of Health (DOH) for the 85% decrease in firework-related injuries (FWRI) and by fire departments for the nonoccurrence of firework-related residence fires (Calleja, 2021). The ban on traditional firework celebrations due to safety and COVID-19 related concerns persisted through 2021 and 2022 (Calleja, 2021; Felipe, 2022; Villanueva, 2022).
The most recent New Year festivities to welcome 2024 are the first in four years “without any restrictions on movement due to the pandemic” (DOH, 2024). Still, the DILG encouraged LGUs to strictly regulate fireworks (Cabalza, 2023). Unfortunately, a total of 609 FWRI cases were reported (DOH, 2024; Mantaring, 2024).
Composition and Associated Risks of Fireworks and Pyrotechnic Devices
Fireworks have unique and particular chemical components. Strontium, calcium, sodium, barium, and copper metal compounds are responsible for producing their intense colors when lit up. Gunpowder made of potassium nitrate, charcoal, and sulfur are used to fuel and allow the fireworks to burn. Nitrates, chlorates, and perchlorates serve as oxidizers to enable the combustion of fuel. (Brunning, 2013) These chemicals all contribute to high and unprecedented levels of suspended particulate matter during firework displays.
Particulate matter (PM) or particle pollution refers to mixtures of solid particles of various sizes and liquid droplets found in the air (United States Environmental Protection Agency, 2023). Two classifications of inhalable PM are PM10 and PM2.5 with diameters 10 micrometers or smaller and 2.5 micrometers or smaller, respectively. Apart from pyrotechnic displays, common sources of PM2.5 are construction sites, power plants, automobiles, fires, agricultural fields, and unpaved roads (US EPA, 2023). For Metro Manila, in particular, high PM2.5 concentrations are attributed to traffic, construction sites, sea salt, road dust, waste processing, and biomass burning (Simpas et al., 2014; Cruz et al., 2019).
Medical professionals and environmentalists alike have lobbied for stricter policies against firecrackers due to the safety, health, and environmental risks they impose. Accidents with fireworks can cause structure and vehicle fires (National Fire Protection Association, 2023). According to a Philippine surveillance report, the most common anatomic sites among the 4706 FWRIs reported between 2000 and 2014 are the hands (44%), legs (21%), and eyes (21%) (Roca et al., 2014). In New Year 2024, the most common types of injuries are blasts and burns without amputations, and eye injuries (Mantaring, 2024). On the other hand, prolonged and high-level exposures trigger chronic or allergic bronchitis, bronchial asthma, sinusitis, rhinitis, pneumonia, and laryngitis (DOH, n.d.).
The PM2.5 from pyrotechnic displays and other sources can pose serious health risks when inhaled or when it enters the bloodstream, especially among populations with pre-existing heart, respiratory, or nervous system diseases (DOH, n.d.). These risks include premature death, nonfatal heart attacks, irregular heartbeat, aggravated asthma, decreased lung function, increased irritation of the airways, coughing, or difficulty breathing (US EPA, 2023).
Manila Observatory’s Annual New Year’s Day PM2.5 Monitoring
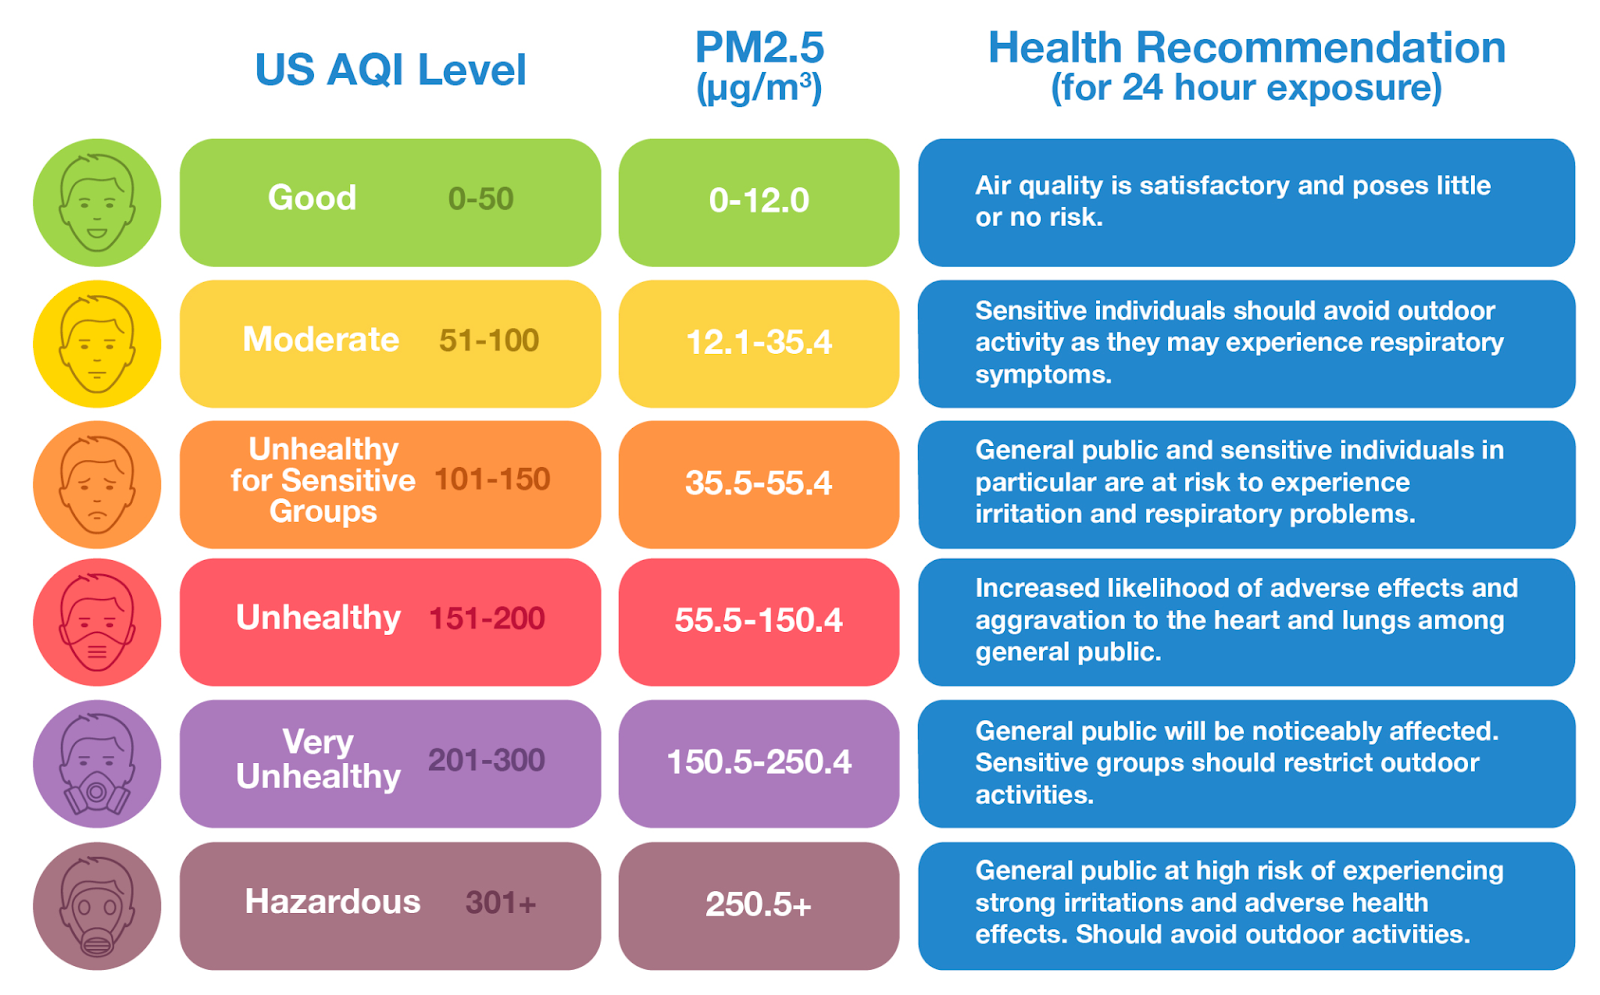
For more than two decades, the Manila Observatory (MO) has been monitoring the air quality in Metro Manila by sampling PM2.5 during annual New Year celebrations. The obtained concentrations are consequently compared and plotted against the United States Environmental Protection Agency (US EPA) Air Quality Index (AQI) categories for 24-hour exposure, shown in Appendix 1 below. The AQI reports and assesses daily air quality to determine how clean or polluted the air is and what its associated health effects are. For instance, daily concentrations between 35.5 and 55.4 micrograms per cubic meter (µg/m3) are considered “unhealthy for sensitive groups” including the elderly, children, and those with pre-existing cardiorespiratory diseases, while concentrations higher than 250.5 µg/m3 are considered “hazardous” for all individuals.
This year, MO deployed portable Teflon-filter-based MiniVol samplers and AS-LUNG outdoor and personal sampler instruments (Lung et al. 2020a & 2020b). Twenty-four hour sampling was conducted using six MiniVol samplers in Antipolo, Rizal; Calumpit, Bulacan; Katipunan, Quezon City (Manila Observatory); Nangka, Marikina City; Almanza, Las Piñas/Parañaque City; and Kaimito, Pasig (Valle Verde). Real-time PM2.5 concentration measurements were obtained using ten AS-LUNG personal sampler instruments in Antipolo, Rizal; Laurel, Batangas; San Jose Del Monte (SJDM), Bulacan; Calumpit, Bulacan; Tagaytay City, Cavite; Davao City, Davao del Sur; Katipunan, Quezon City (Manila Observatory); Nangka, Marikina City; and BF Homes, Parañaque City. An AS-LUNG outdoor sampler (Lung et al. 2020a & 2020b) was also deployed in Nangka, Marikina City. Hourly PM2.5 data from Ermita, Manila (Embassy of the United States of America) as recorded by AirNow’s US EPA endorsed instrument was also analyzed (AirNow, 2024). Figure 1 below summarizes the sampling locations listed above.
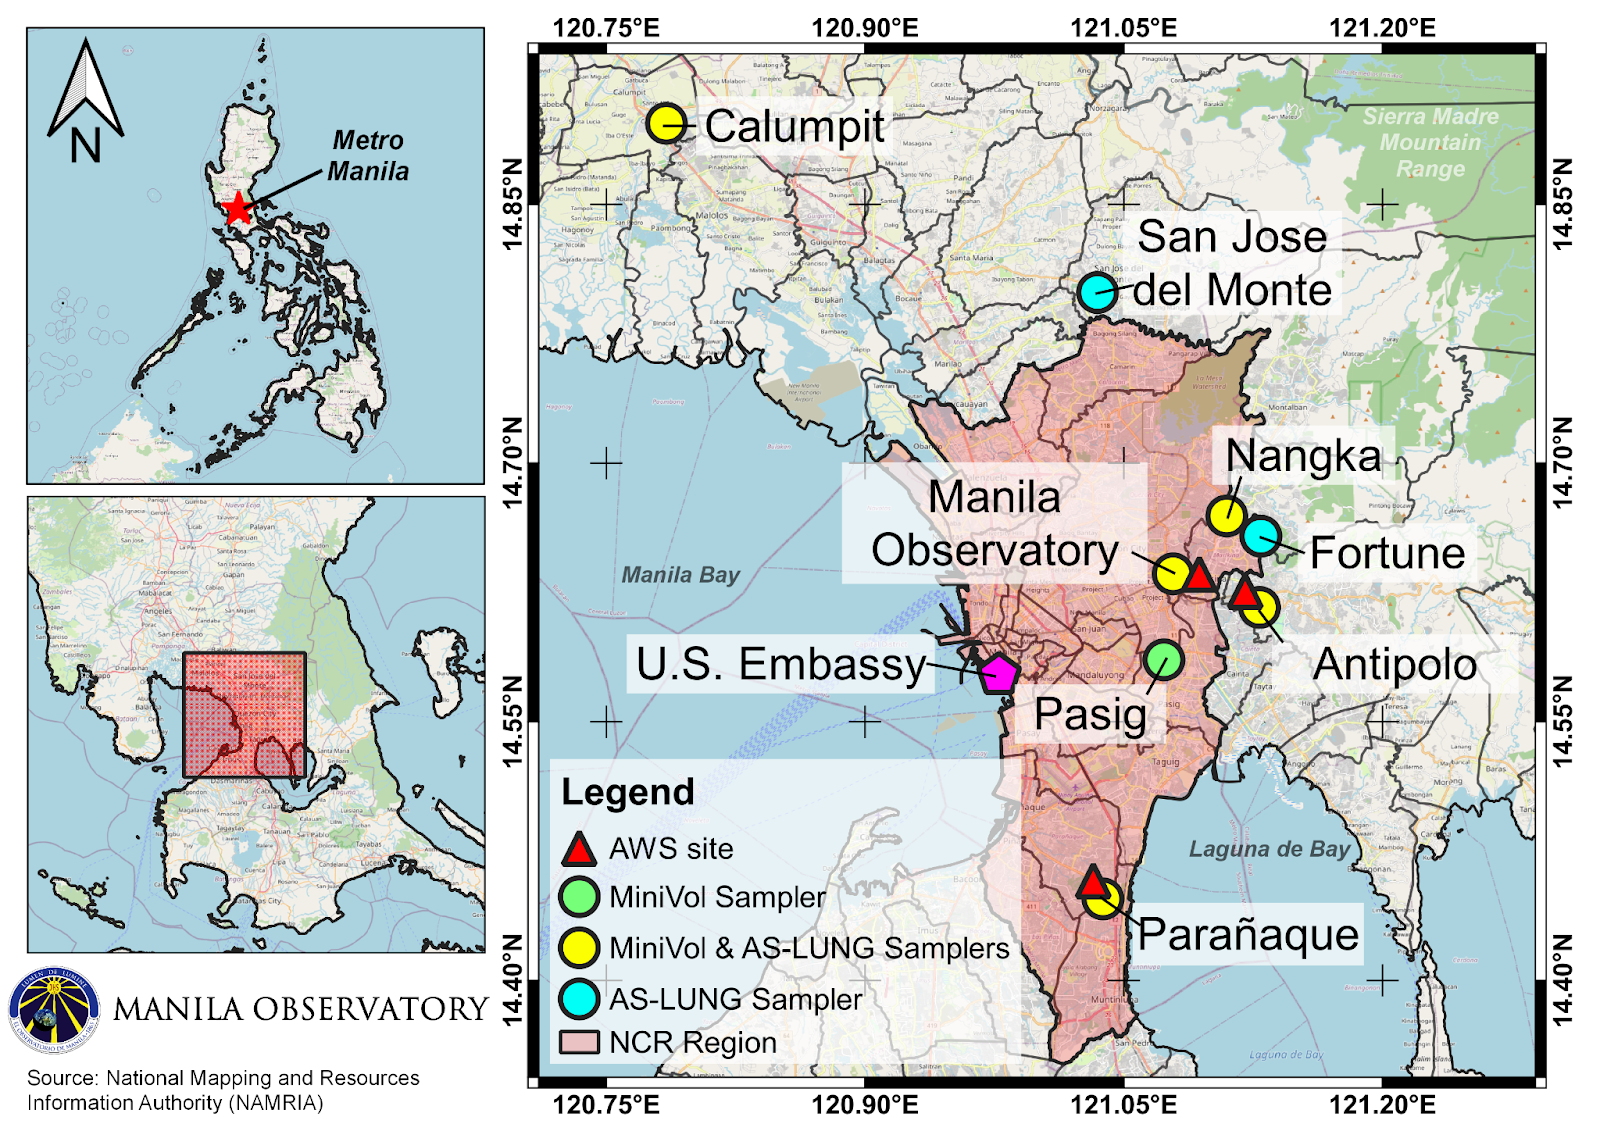
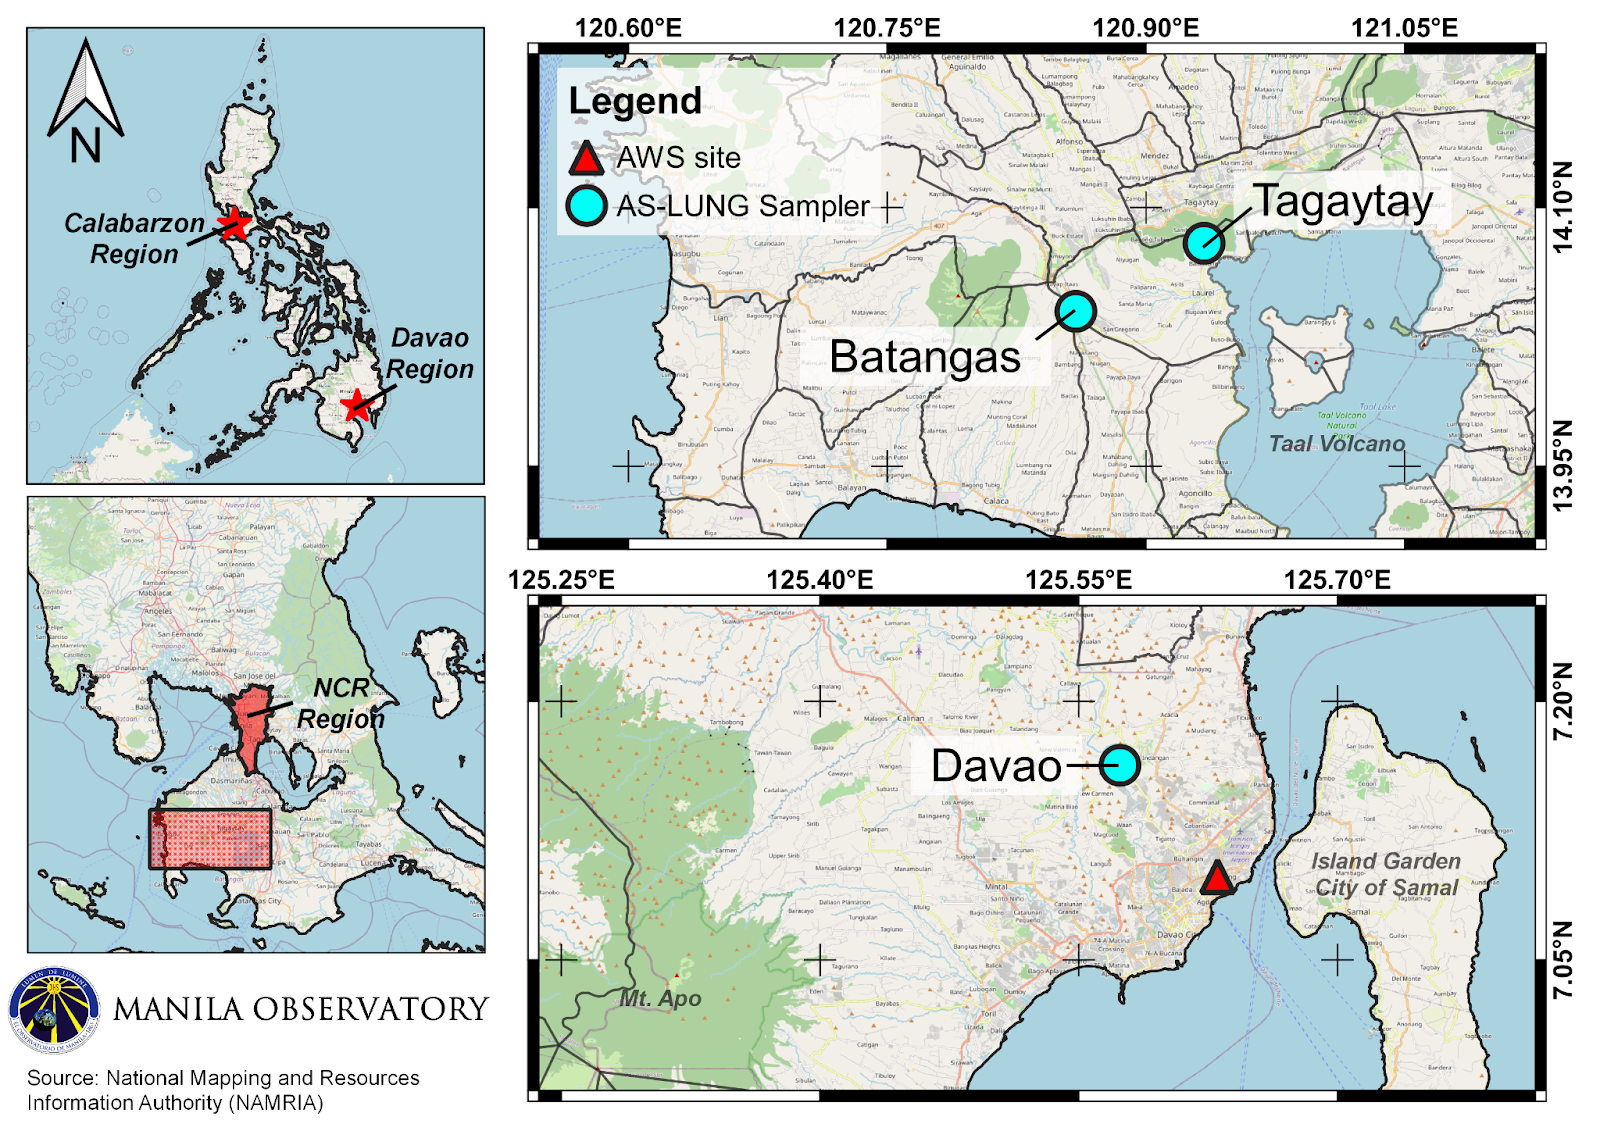
Figure 1. PM2.5 filter-based and continuous sampling measurement locations (a) within Metro Manila and (b) in other regions during New Year 2024.
Twenty-Four Hour PM2.5 Concentrations
The data recorded by the MiniVol samplers at the six aforementioned sampling sites reveal that PM2.5 concentrations are at unhealthy levels for all sites, except for Almanza, Las Piñas/Parañaque City (7 µg/m3, “good”). The highest concentration level was observed in Calumpit, Bulacan (132 µg/m3), followed by Kaimito, Pasig (109 µg/m3), Nangka, Marikina (101 µg/m3), Katipunan, Quezon City (79 µg/m3), and Antipolo, Rizal (78 µg/m3). When compared to the concentration levels observed in 2023, Calumpit, Nangka, and Katipunan had 65%, 53%, and 20% increases respectively while Antipolo and Almanza had decreases of 14% and 78% respectively. No 2023 data is available for the Kaimito site, thus, no comparison can be made.
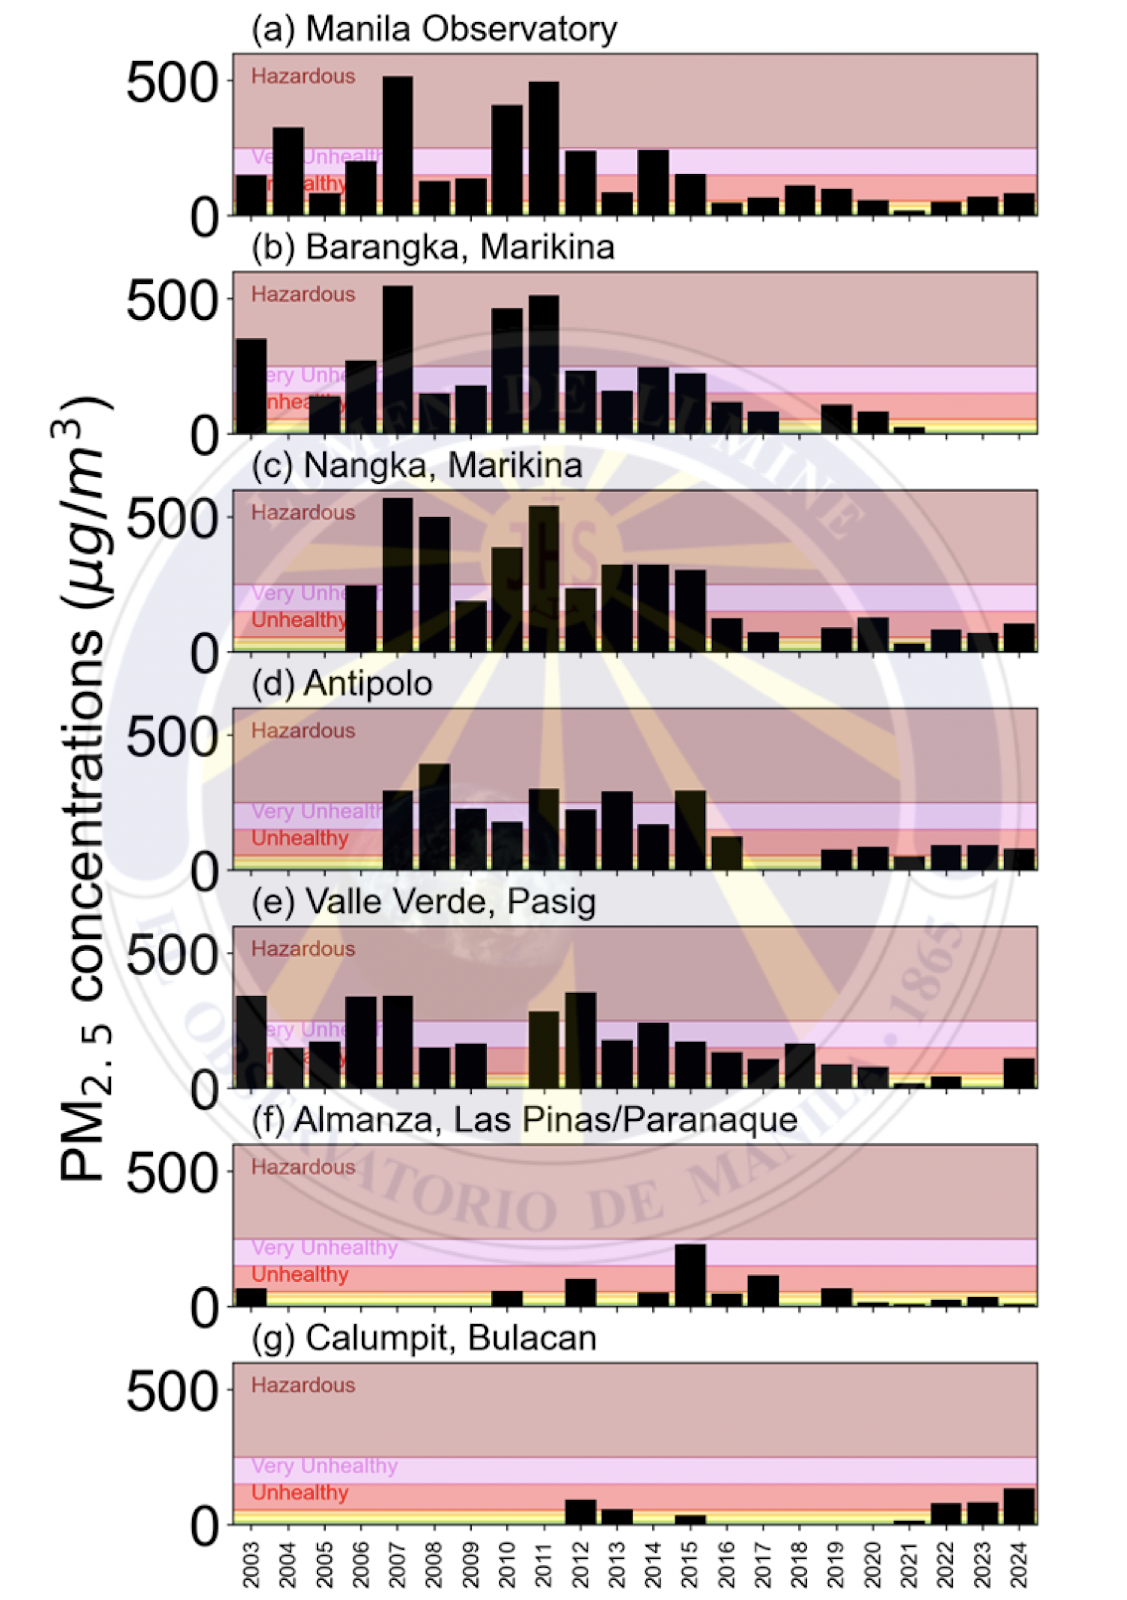
Figure 2. The long-term New Year PM2.5 concentrations from 2003 to 2024 overlaid with the U.S. EPA’s Air Quality Index (AQI) for 24-hour PM2.5 concentrations.
A noticeable decrease in concentrations can be observed in the current decade (2015-2024) compared to the previous decade (2005-2014). For example, the Manila Observatory site, which has complete data from 2003, had an average concentration of 252 µg/m3 from 2005 to 2014 but only 73 µg/m3 from 2015 to 2024. This corresponds to a 71% decrease in PM2.5 concentrations between the two decades. This may be attributed to the DOH campaign against fireworks and the PNP anti-illegal firecracker drive that began in 2015 (Rappler, 2016), former president Duterte’s Executive Order No. 28 in 2017, and the total ban on fireworks at the height of the pandemic in 2020.
The gradual increase in PM2.5 concentrations beginning 2022 can be attributed to the reopening of the economy, increased mobility, and relaxed (in comparison to total ban in 2020) policies on firecrackers. In fact, the concentration levels recorded this year– when both pyrotechnic and mobility restrictions are least strict– are the highest for the Katipunan, Almanza, and Calumpit sites in the past 5 years.
Real-Time PM2.5 Concentrations
The AS-LUNG personal sampler instruments measure particulate matter concentrations every 15 seconds, providing a finer temporal resolution. High resolution monitoring of PM2.5 concentrations is important because it allows individuals to manage acute exposures to pollution. Figure 3 shows the real-time PM2.5 concentrations for all sampling sites of the AS-LUNG personal sampler instruments in 2024. For the Nangka, Marikina site, the AS-LUNG outdoor sampling instrument data (1-minute resolution) was plotted instead of the personal sampler data. For the Ermita, Manila (Embassy of the USA) site, the outdoor instrument data (1-hour resolution) was plotted.
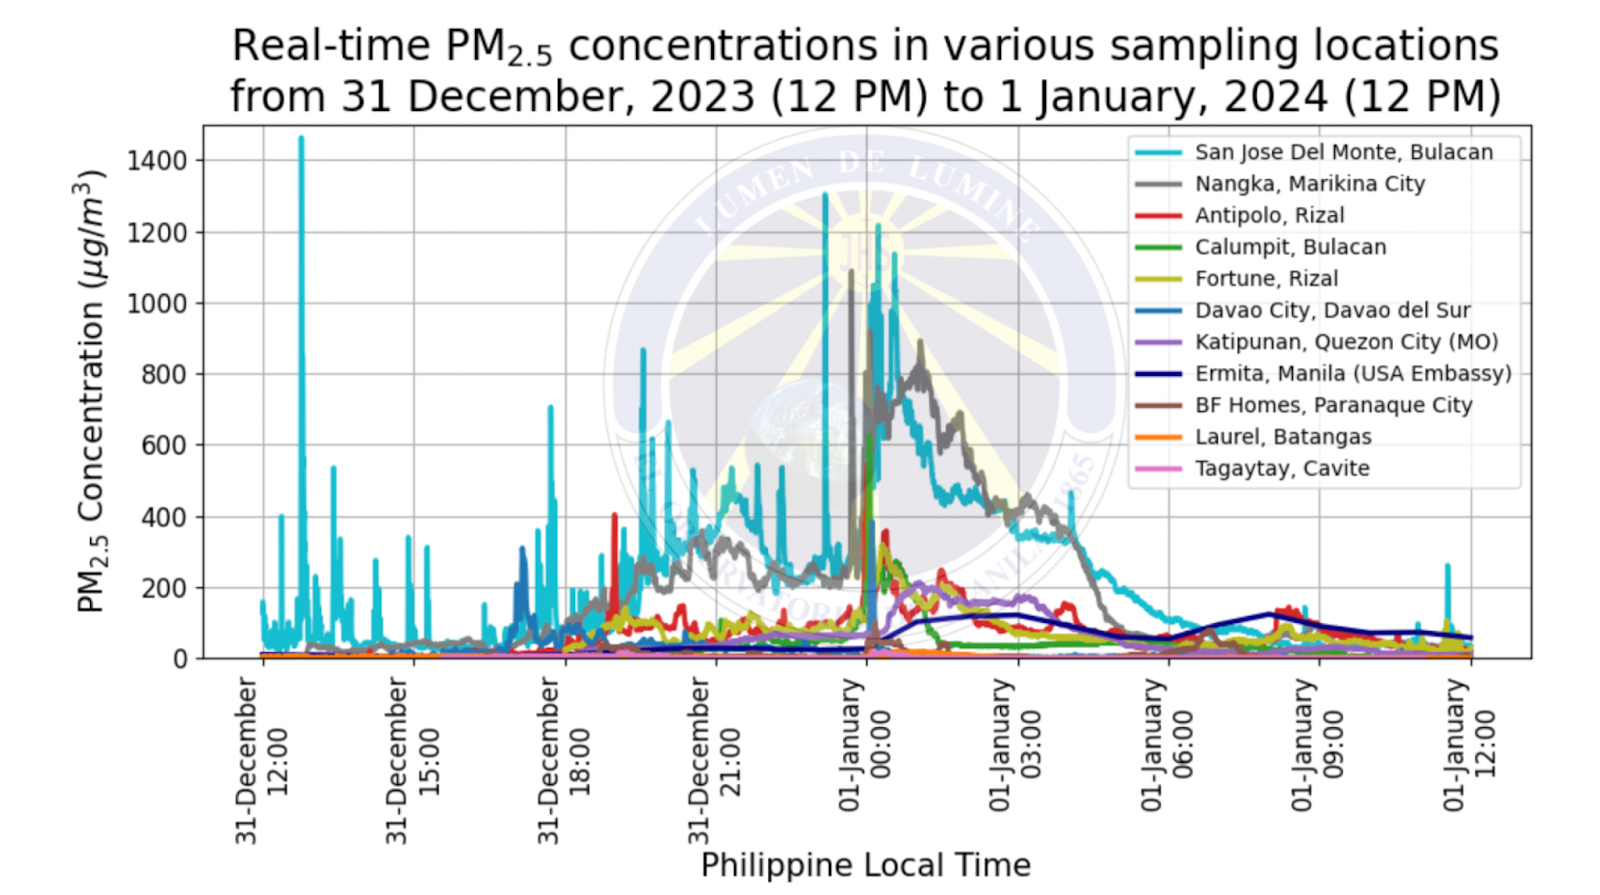
Figure 3. Real-time PM2.5 concentrations for New Year 2024.
Elevated PM2.5 concentrations can be observed across two time periods. The first period is between 6 pm and 12 mn on December 31. At this period, a wide envelope of elevated and gradually increasing concentrations can be observed that is likely a result of emissions from vehicle exhausts, grilling, and isolated firecrackers. The data from the SJDM, Bulacan site clearly demonstrates this pattern. The PM2.5 concentrations show a gradual increase starting at 6 pm, which was noted to coincide with the time when nearby households conducted cooking preparations for Media Noche and when an increased number of motorcycles were present in the sampling site. The peak concentrations were observed at 12:46 pm on December 31, when several firecrackers were lit near the sampling site.
A different pattern can be observed in the data recorded in Katipunan, Quezon City. The Manila Observatory site is part of an urban atmospheric environment (Bloss, 2012) but is sufficiently removed from nearby sources. Thus, the signal of PM2.5 concentrations observed is slightly elevated but relatively smooth due to typical urban sources such as traffic and vehicular exhaust. PM2.5 from fireworks take more time to be advected to the site but still contribute to the overall concentration.
At midnight, large spikes of PM2.5 concentrations are observed in most sampling sites. For Fortune, Davao, Antipolo, Calumpit, and Nangka, hazardous real-time concentrations were observed within one hour of the New Year (January 1, 2024, 12:00 mn). At these alarming levels, everyone is recommended to stay indoors, wear appropriate personal protective equipment such as air-filtering masks (Xu et al., 2020), and use HEPA and personal air filters (AirNow, 2023). The maximum concentrations for Laurel, Quezon City, Tagaytay, and Parañaque City were observed within this same time period. The spikes in PM2.5 during this time period may be linked with nearby firework explosions and motor vehicular emissions (i.e. from revving up motorcycles or cars to produce noise).
The second time period with elevated PM2.5 concentrations are in the hours immediately after midnight. At this period, the concentrations are elevated but are slowly tapering off. For some sites, such as Nangka and SJDM, the perceived absence of winds and precipitation likely prolonged the presence of elevated PM2.5 concentrations. Elevated PM2.5 concentrations at these two sites can be observed until 4 am and 6 am of January 1, respectively. Figure 4 shows an image of the Katipunan, Marikina, and Rizal area taken at 6:32 am on January 1. The image clearly shows haze and poor visibility and air quality as an aftermath of New Year celebrations.
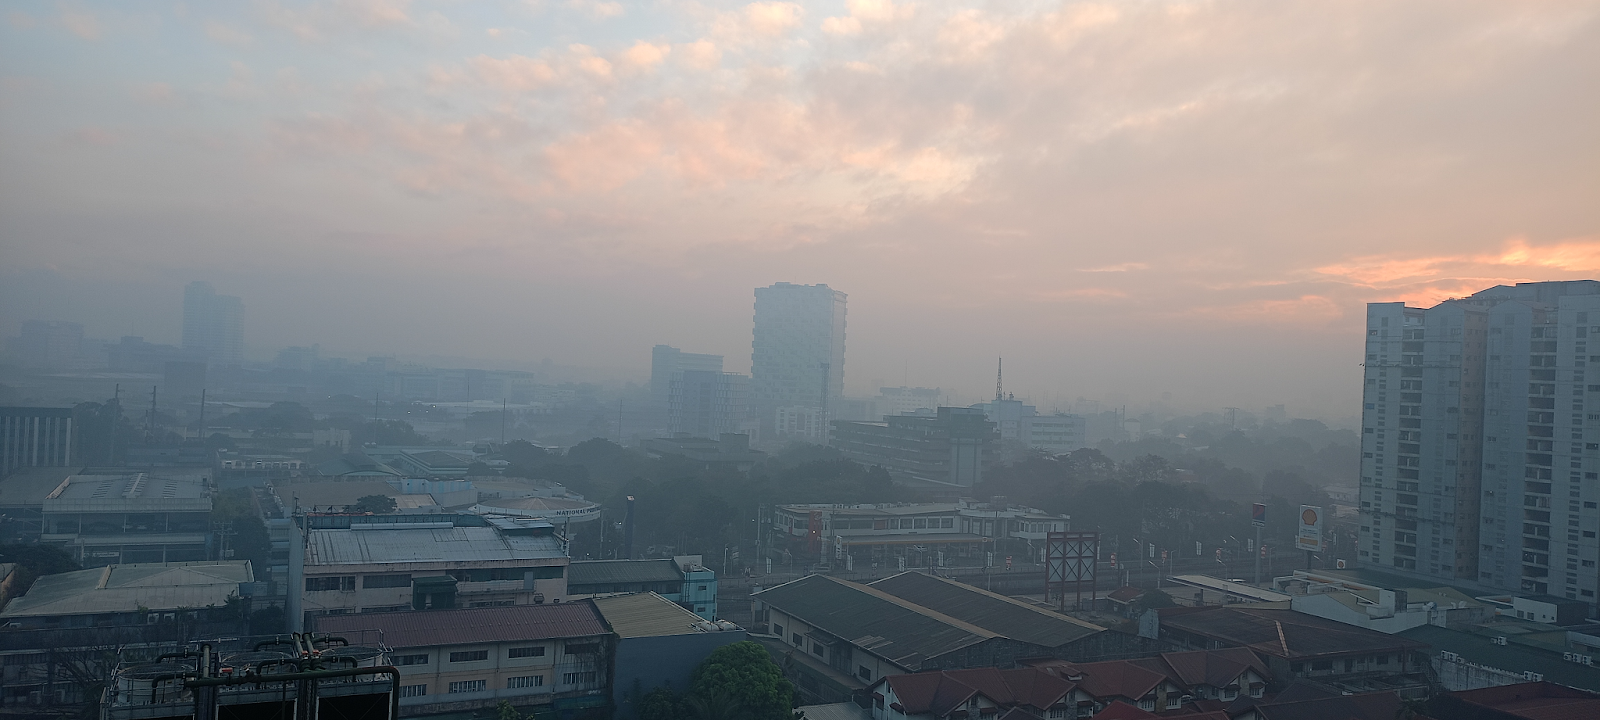
Figure 4. New Year haze in the Katipunan, Marikina, and Rizal area taken at 6:32 am on January 1.
Indoor and Outdoor Air Quality in Nangka, Marikina City
This New Year is also the first time that indoor and outdoor measurements of PM2.5 were recorded concurrently in the same location of Nangka, Marikina. The distance between the two sensors is approximately 10 meters. No indoor human activity took place in the time of sampling, thus making the indoor measurements a reliable control value for comparison. Figure 5 shows the indoor and outdoor PM2.5 concentrations for the Nangka, Marikina City sampling site.
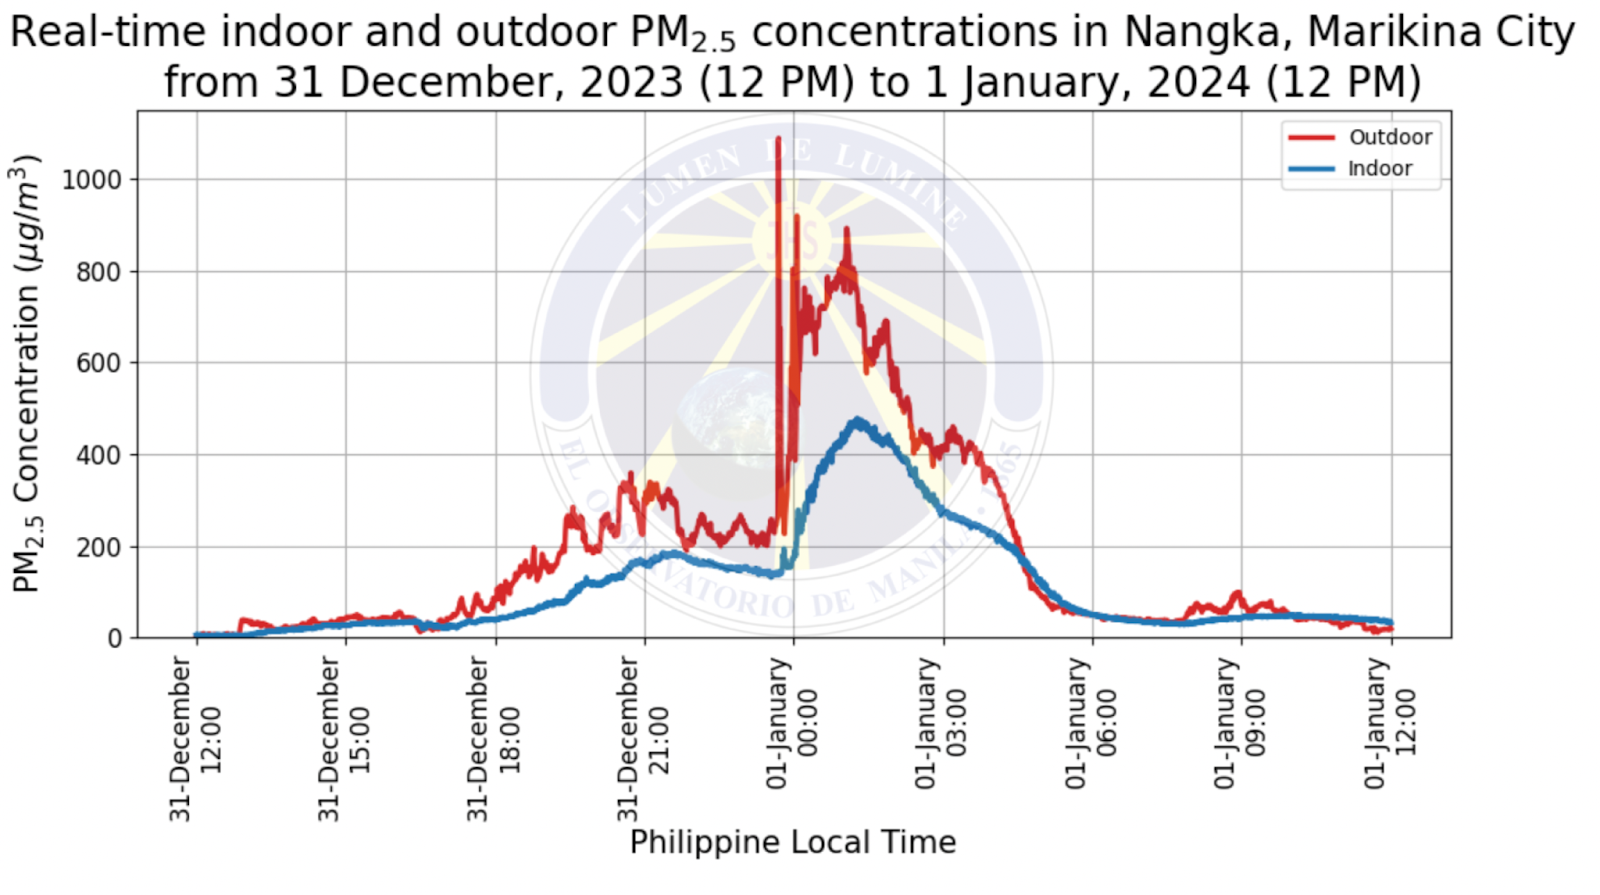
Figure 5. Real-time indoor and outdoor PM2.5 concentrations in Nangka, Marikina City for New Year 2024.
The indoor and outdoor PM2.5 concentrations exhibit similar trends. Like the real-time data from other sampling sites, there is a period of elevated and gradually increasing PM2.5 concentrations between 6 pm and 12 mn of December 31, a sharp spike for the outdoor concentrations at 12 mn, and gradually decreasing concentrations from 12 mn to 6 am of January 1. However, there is a perceptible lag of approximately 90 minutes between the peaks of the outdoor and indoor concentrations. Indoor-outdoor concentration ratios are strongly influenced by infiltration (i.e. “uncontrolled air movement between indoor and outdoor environments”) and ventilation rates (Stamp et al., 2022). The 90 minute difference between peaks roughly corresponds to the infiltration time of outdoor air entering the indoor environment.
As expected, the outdoor concentrations are about twice as high as the indoor concentrations because most PM2.5 sources are located outdoors. However, the high average indoor concentrations, which also falls under the “hazardous” level of health concern, is still alarming especially considering that no indoor human activities contributed to this concentration level. Furthermore, the spike observed after midnight took around 5 hours before tapering off. This slow rate of decrease in indoor PM2.5 concentrations can be attributed to poor ventilation, as it was noted that the windows were closed in the sampling site.
Meteorological Conditions during the New Year Celebration
Only four weather stations near the deployed PM2.5 samplers were available to record wind data: (1) SM Masinag, Antipolo; (2) SM BF Homes, Parañaque, (3) Marikina River Park, and (4) SM Lanang, Davao City. As shown in Figure 6, the weather stations in SM Masinag (Antipolo) and Marikina River Park recorded fluctuating wind directions from 12 nn to 11 pm of December 31. Then, both of these sites experience a low wind speed of 0.1 m/s during the midnight fireworks display. The increased PM2.5 concentrations may be attributed to the low wind speed observed during this period. Additionally, the SM BF Homes (Parañaque) site has a prevailing wind from the southeast with wind speeds between 0.5 and 1.2 m/s. These southeasterly winds that were predominantly coming from Laguna de Bay could also be attributed to the decreased PM2.5 concentrations found in the Parañaque site. Lastly, the SM Lanang (Davao) site experiences prevailing winds ranging from east to northeast (0.7 – 1.9 m/s). Note that these four sites show no record of precipitation data.
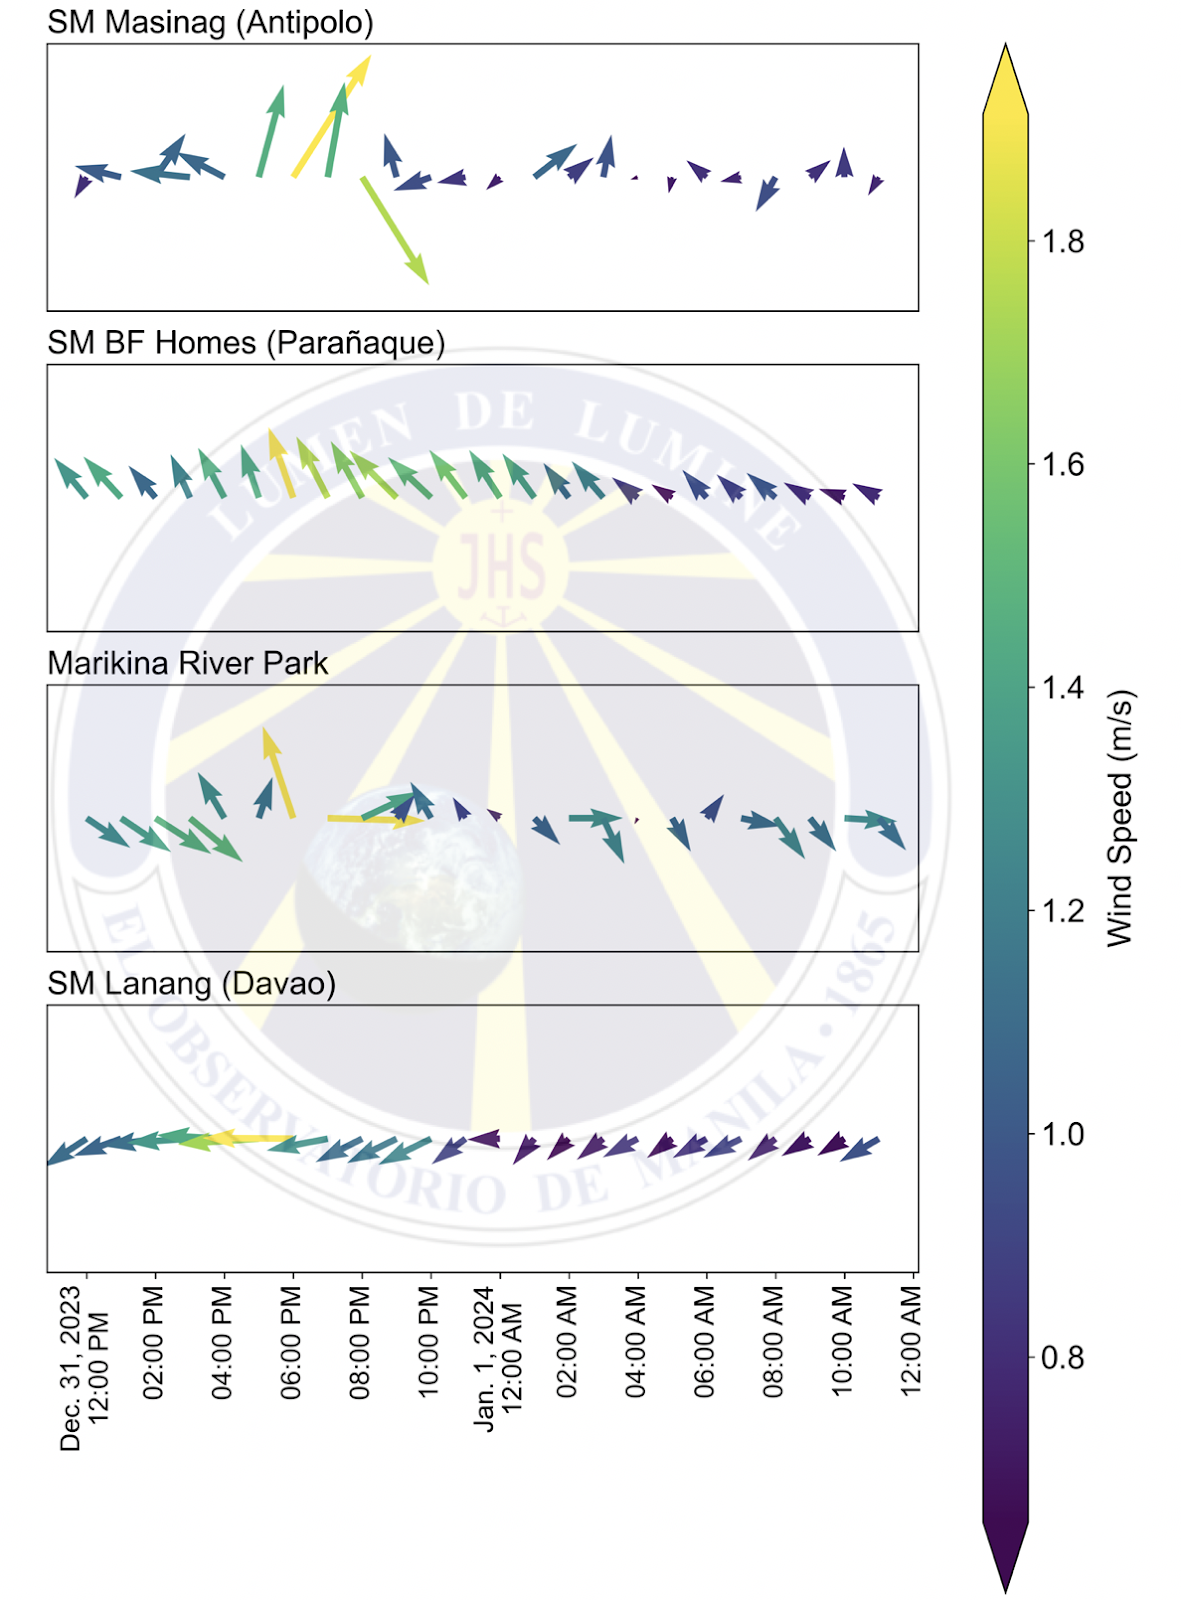
Figure 6. Wind speed and direction (arrows point to the direction where the wind is blowing).
Since some of the automatic weather station (AWS) sites are not available, the surface wind profiles (10-meter) for each site were estimated using the hourly ERA5 Reanalysis Data (0.25° by 0.25° resolution) by calculating the nearest ERA5 gridpoint to each PM2.5 sampling site, as shown in Figure 7. Most of the sites experience low wind speeds (0 – 1.5 m/s) from noon to midnight and then a light breeze (1.6 – 3.3 m/s) after midnight. It is also observed that the whole country experiences northeasterly winds (also known as Amihan) with relatively low wind speeds (Figure 8). Simultaneously, the absence of precipitation may have led to the increased PM2.5 concentrations during the New Year’s Eve celebrations.
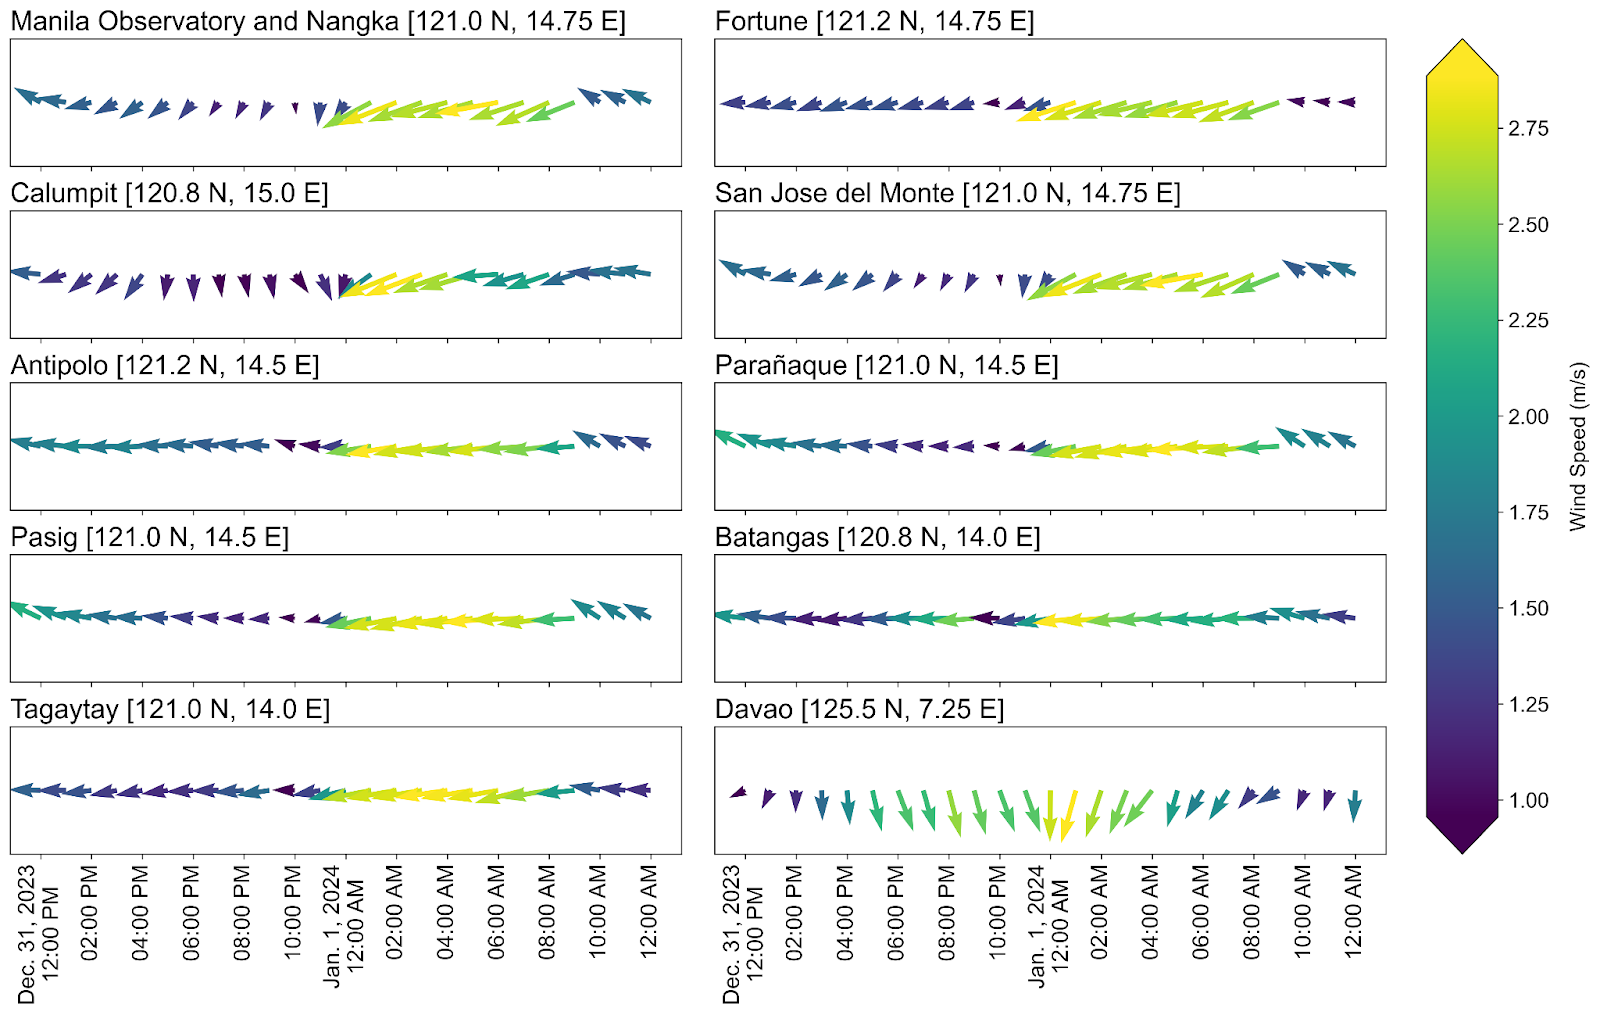
Figure 7. Estimated mean wind speed and direction from hourly ERA5 Reanalysis Data from December 31, 2023 (12 p.m.) to January 1, 2024 (12 p.m.). Due to the coarse spatial resolution of the dataset, there are sites that share a similar gridpoint.
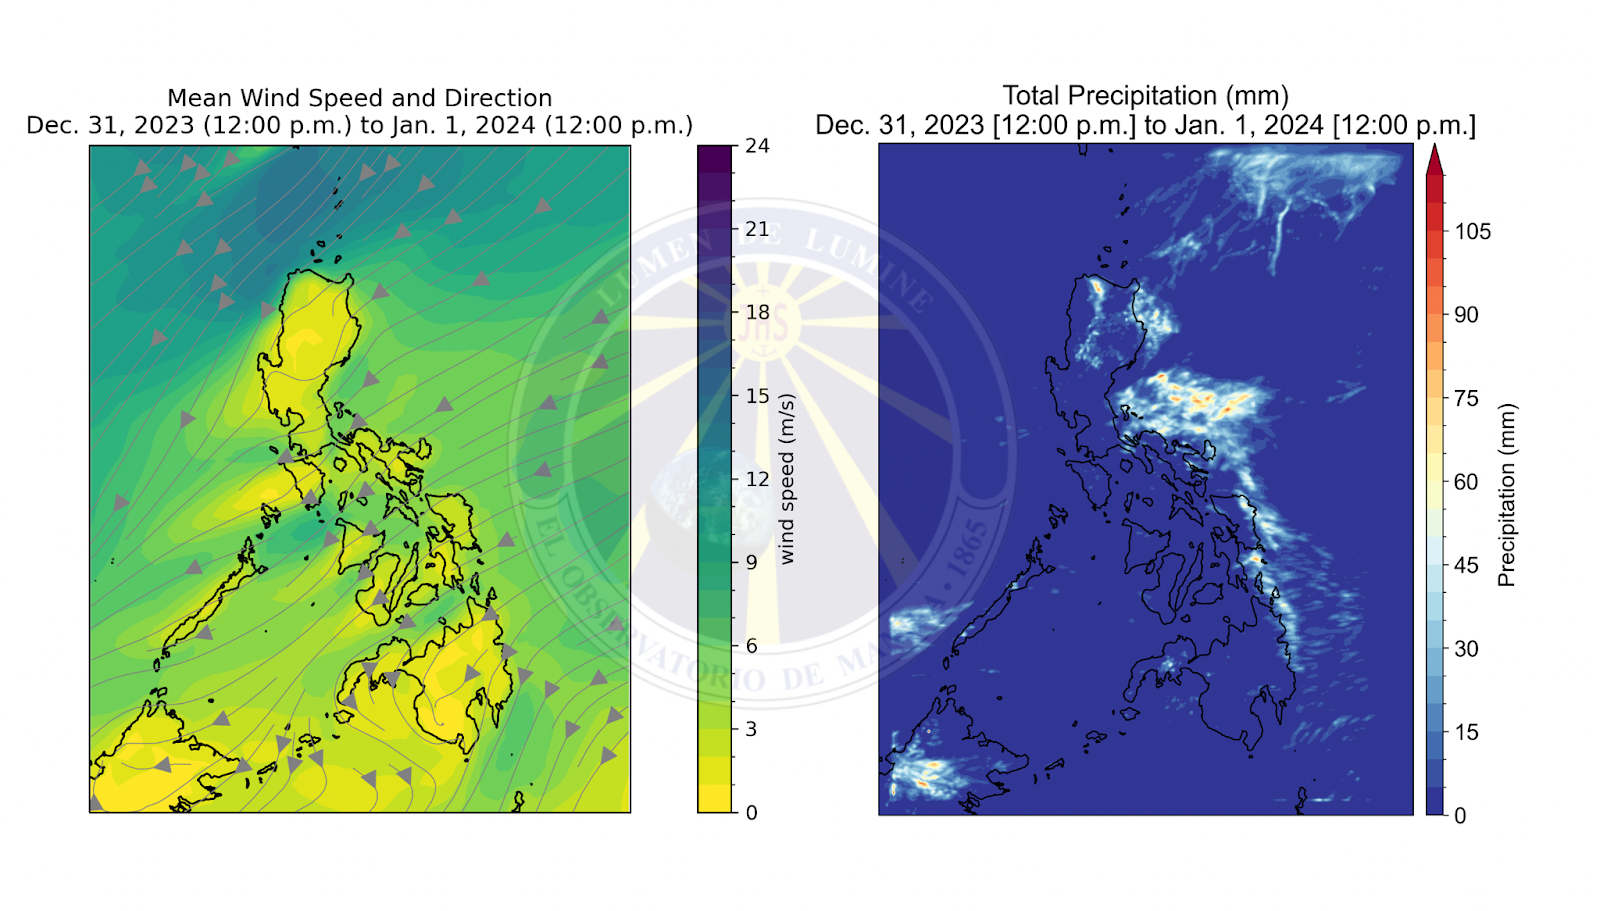
Figure 8. Mean wind speed and direction from ERA5 Reanalysis Data and total precipitation from Weather Research and Forecasting (WRF) (5-km resolution).
Political and meteorological aspects affect observed PM2.5 concentrations during New Year celebrations. With most mobility bans being lifted in 2024, there is a perceptible increase in PM2.5 between 2023 and 2024. In particular, Calumpit, Nangka, and Katipunan had 65%, 53%, and 20% increases respectively. PM2.5 concentrations were elevated for up to six hours before and after the midnight of January 1, and exhibit significant spikes within an hour of midnight at most sampling sites. Apart from the presence of PM2.5 sources, the increased PM2.5 concentrations may be attributed to poor dispersion due to the low wind speed and absence of precipitation during this period. The highest PM2.5 concentrations were observed in San Jose Del Monte, Bulacan, Nangka, Marikina City, and Antipolo, Rizal. The comparison of indoor and outdoor PM2.5 concentrations in Nangka, Marikina also shows a lag between the peaks of PM2.5 concentrations influenced by infiltration and ventilation rates. Alarmingly, even in the absence of indoor human activities that may emit PM2.5, indoor concentrations reached hazardous levels that can be attributed to poor ventilation. In light of these findings, it is imperative for the general public to be aware of safety measures against PM2.5 exposure during New Year celebrations.
Appendices
Appendix 1. United States Environmental Protection Agency (US EPA) Air Quality Index (AQI) categories for 24-hour exposure (IQAir, 2018)
References
AirNow. (2024). U.S. Embassies and Consulates – Philippines, Manila. Retrieved from https://www.airnow.gov/international/us-embassies-and-consulates/#Philippines$Manila
AirNow. (2023). Air Quality Guide for Particle Pollution. Retrieved from https://document.airnow.gov/air-quality-guide-for-particle-pollution.pdf
Bloss, W. (2012). Urban Atmospheric Composition Processes. In Encyclopedia of Environmental Management. Springer. Retrieved from https://link.springer.com/referenceworkentry/10.1007/978-1-4419-0851-3_493
Brunning, A. (2013, December 30). The chemistry of the colours of fireworks. Compound Interest. https://www.compoundchem.com/2013/12/30/the-chemistry-of-fireworks/
Cabalza, D. (2023, December 28). Be strict with firecracker ban, Abalos tells local governments. Philippine Daily Inquirer. https://newsinfo.inquirer.net/1880292/be-strict-with-crackerban-local-govts-told
Calleja, J. P. (2021, December 8). Philippines bans fireworks again at Christmas. UCA News. https://www.ucanews.com/news/philippines-bans-fireworks-again-at-christmas/95289
Cruz, M. T., Bañaga, P. A., Betito, G., Braun, R. A., Stahl, C., Aghdam, M. A., Cambaliza, M. O., Dadashazar, H., Hilario, M. R., Lorenzo, G. R., Ma, L., MacDonald, A. B., Pabroa, P. C., Yee, J. R., Simpas, J. B., & Sorooshian, A. (2019). Size-resolved composition and morphology of particulate matter during the southwest monsoon in Metro Manila, Philippines. Atmospheric Chemistry and Physics, 19(16), 10675–10696. https://doi.org/10.5194/acp-19-10675-2019
Department of Health. (2024, January 1). Day 11 Alert: A new hope this New Year. Retrieved from https://doh.gov.ph/Press-release/DAY-11-ALERT-A-NEW-HOPE-THIS-NEW-YEAR
Department of Health. (n.d.). What are the health effects of using fireworks/firecrackers? Retrieved from https://doh.gov.ph/faqs/What-are-the-health-effects-of-using-fireworks/firecrackers#:~:text=Increase%20in%20the%20sound%20levels,%2C%20rhinitis%2C%20pneumonia%20and%20laryngitis.
IQAir. (2018). What is AQI? Retrieved from https://www.iqair.com/newsroom/what-is-aqi
Lung, S.-C. C., Tsou, M.-C. M., Hu, S.-C., Hsieh, Y.-H., Wang, W.-C. V., Shui, C.-K., & Tan, C.-H. (2020). Concurrent assessment of personal, indoor, and outdoor PM2.5 and PM1 levels and source contributions using novel low-cost sensing devices. Indoor Air, 30(1), 52–67. https://doi.org/10.1111/ina.12763
Lung, S.-C. C., Wang, W.-C. V., Wen, T.-Y. J., Liu, C.-H., & Hu, S.-C. (2020). A versatile low-cost sensing device for assessing PM2.5 spatiotemporal variation and quantifying source contribution. Science of The Total Environment, 716, 137145. https://doi.org/10.1016/j.scitotenv.2020.137145
Mantaring, J. R. (2024, January 6). DOH: Firecracker-related injuries for 2024 New Year festivities hit 609, highest in 7 years. CNN Philippines. https://www.cnnphilippines.com/news/2024/1/6/doh-over-600-firecracker-related-injuries.html
National Fire Protection Association. (2023). Fireworks. Retrieved from https://www.nfpa.org/education-and-research/home-fire-safety/fireworks
Official Gazette of the Republic of the Philippines. (2017, June 20). Executive Order No. 28. Retrieved from https://www.officialgazette.gov.ph/downloads/2017/06jun/20170620-EO-28-RRD.pdf
Ranada, P. (2020, December 26). Fireworks to welcome 2021? What’s allowed, not allowed. Rappler. https://www.rappler.com/nation/guidelines-fireworks-new-year-philippines-2021/
Rappler.com. (2016, January 1). DOH: 53% drop in fireworks-related injuries in 2015. Retrieved from https://www.rappler.com/nation/117672-lower-firecracker-injuries-2015/
Roca, J. B., Carr de los Reyes, V., Racelis, S., Deveraturda, I., Sucaldito, M. N., Tayag, E., & O’Reilly, M. (2015). Fireworks-related injury surveillance in the Philippines: Trends in 2010–2014. Western Pacific Surveillance and Response Journal, 6(4), 1–6. https://doi.org/10.5365/WPSAR.2015.6.1.014
Servallos, N. J. (2020, December 25). Metro Manila mayors ban firecrackers. The Philippine Star. https://www.philstar.com/nation/2020/12/25/2066159/metro-manila-mayors-ban-firecrackers
Simpas, J., Lorenzo, G., & Cruz, M. T. (2014). Monitoring particulate matter levels and composition for source apportionment study in Metro Manila, Philippines. In N. T. Kim Oanh (Ed.), Improving Air Quality in Asian Developing Countries: Compilation of Research Findings (pp. 239–261). NARENCA, Vietnam Publishing House of Natural Resources, Environment and Cartography, Vietnam.
Stamp, S., Burman, E., Chatzidiakou, L., Cooper, E., Wang, Y., & Mumovic, D. (2022). A critical evaluation of the dynamic nature of indoor-outdoor air quality ratios. Atmospheric Environment, 273, 118955. https://doi.org/10.1016/j.atmosenv.2022.118955
Suerte Felipe, C. (2022, December 23). Marcos to LGUs: Set up common fireworks areas. OneNews.ph. https://www.onenews.ph/articles/marcos-to-lgus-set-up-common-fireworks-areas
U.S. Environmental Protection Agency. (2023). Health and Environmental Effects of Particulate Matter (PM). Retrieved from https://www.epa.gov/pm-pollution/health-and-environmental-effects-particulate-matter-pm
U.S. Environmental Protection Agency. (2023). Particulate Matter (PM) Basics. Retrieved from https://www.epa.gov/pm-pollution/particulate-matter-pm-basics
Villanueva, R. E. (2022, December 27). Quezon City bans households from holding fireworks displays. The Philippine Star. https://www.philstar.com/nation/2022/12/27/2233438/quezon-city-bans-households-holding-fireworks-displays
Xu, J., Xiao, X., Zhang, W., Xu, R., Kim, S. C., Cui, Y., Howard, T. T., Wu, E., & Cui, Y. (2020). Air-filtering masks for respiratory protection from PM2.5 and pandemic pathogens. One Earth, 3(5), 574–589. https://doi.org/10.1016/j.oneear.2020.10.014