by Zenn Marie Cainglet, Aubrey May De Francisca, Paola Banaga, Shane Marie Visaga, Melliza Templonuevo Cruz, James B. Simpas, Maria Obiminda Cambaliza, Fr. Jose Ramon Villarin, SJ, and Fr. Daniel McNamara, SJ
Summary
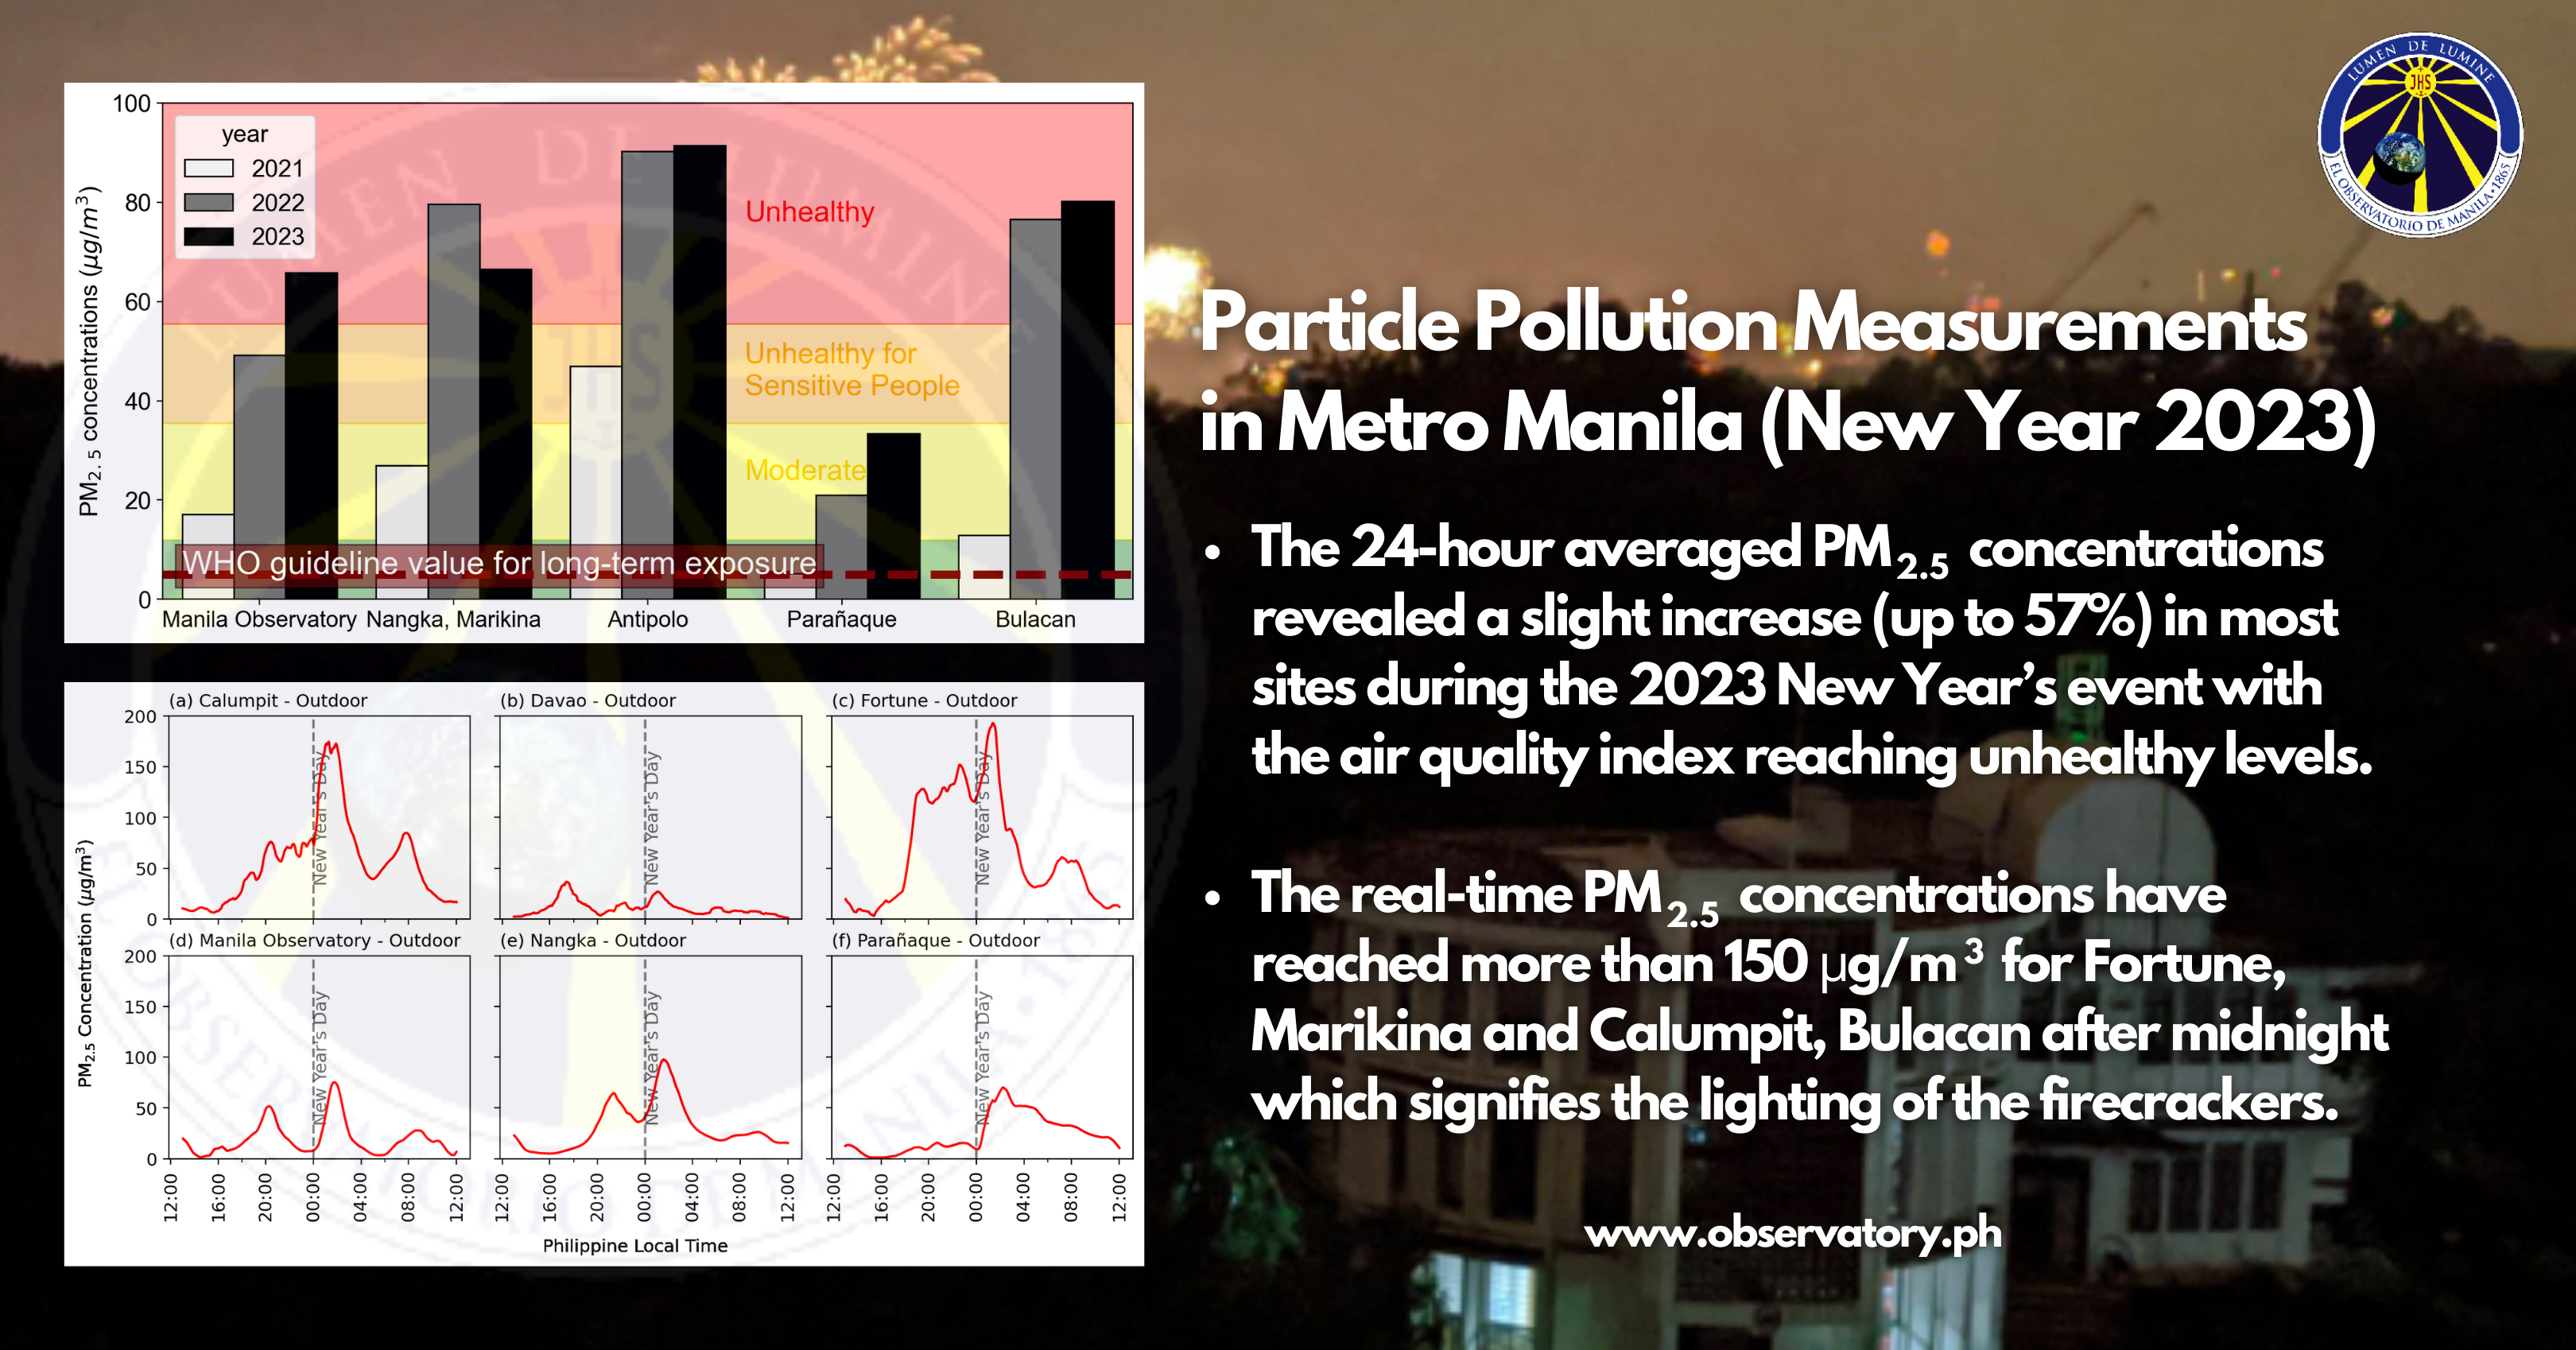
- The 24-hour averaged PM2.5 concentrations revealed a slight increase (up to 57%) in most sites during the 2023 New Year’s event with the air quality index reaching unhealthy levels.
- The real-time PM2.5 concentrations have reached more than 150 μg/m3 for Fortune, Marikina and Calumpit, Bulacan after midnight which signifies the lighting of the firecrackers.
Introduction
New Year’s Eve (NYE) in and around Metro Manila is celebrated with loud noises, sumptuous festivities, and bright fireworks. However, this tradition has been halted due to stringent lockdowns for the previous two years, along with the implementation of Executive Order No. 28 which limits the use of firecrackers to community firework displays. This firework ban is still in effect this year, but some amendments have been done to allow people to return to pre-pandemic traditions. For instance, the ban on the manufacture, sale, and use of permissible fireworks has been lifted in a few places, such as in Valenzuela City (Ong, 2022). Moreover, face masks were now optional for outdoor setups, and face-to-face social gatherings were back. Despite soaring inflation rates in the country (about 8% in December 2022) that resulted in the price increase of fireworks, it was reported that many have continued to celebrate NYE with more expensive aerial pyrotechnics than traditional firecrackers (Monzon, 2022).
Although fireworks produce spectacular light and sound effects, they have harmful environmental and health impacts. Previous studies have shown that the burning of firecrackers and fireworks contributes to the sharp increase of fine particulate matter (PM2.5) and other gaseous pollutants such as sulfur dioxide (SO2), nitrogen oxides (NOX), and organic compounds into the atmosphere (Greven et. al., 2019, Lorenzo et al., 2021, Tanda et al., 2019, & Singh et. al., 2019). The elevated concentrations could increase up to 2-8 times in the ambient atmosphere, causing adverse health effects, especially to children and members of vulnerable groups.
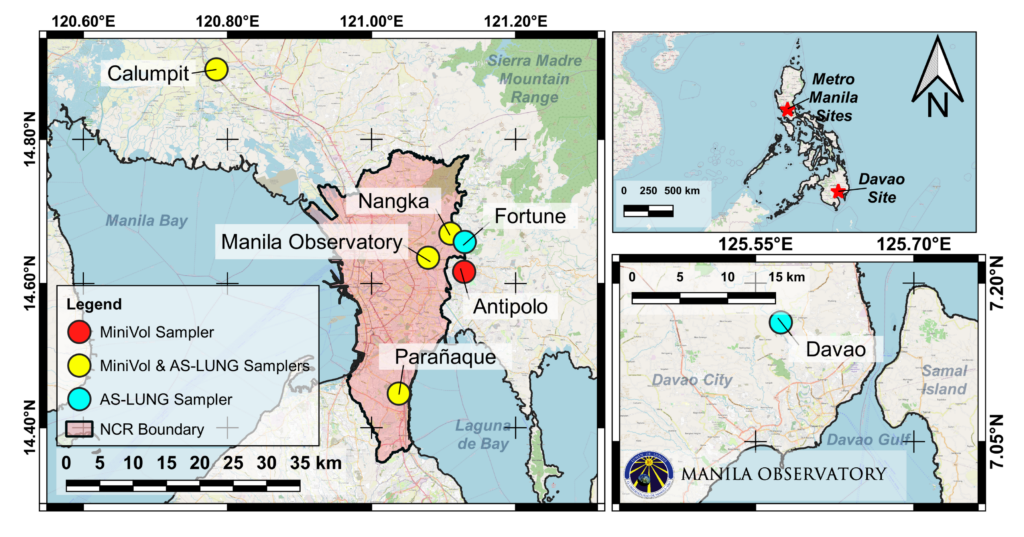
Since 2003, the Manila Observatory has been monitoring PM2.5 levels during the New Year’s Eve celebration in Metro Manila and nearby regions. As part of the long-term monitoring efforts, portable air samplers were deployed to monitor the 2023 New Year event. MiniVol portable air samplers were deployed in five locations, as indicated in Figure 1: (1) Calumpit, Bulacan; (2) Nangka, Marikina; (3) Manila Observatory, Quezon City; (4) Mambugan, Antipolo, and (5) BF Homes, Parañaque. In addition to filter-based PM2.5 sampling, real-time PM2.5 measurements were performed using AS-LUNG personal samplers deployed in six sites: (1) Calumpit, Bulacan; (2) Nangka, Marikina; (3) Manila Observatory, Quezon City; (4) BF Homes, Parañaque; (5) Fortune, Marikina; and (6) Buhangin, Davao City.
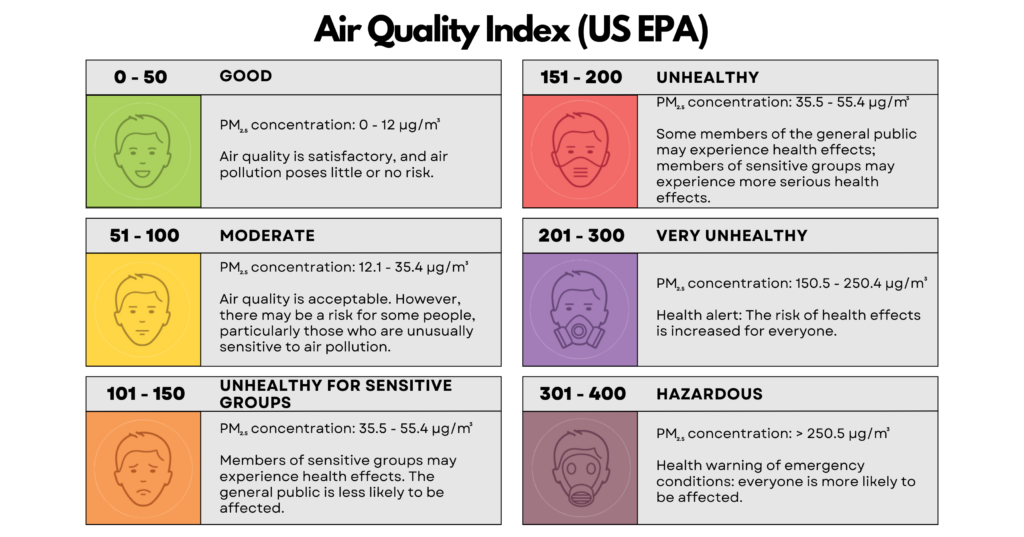
To assess the associated health effects of ambient PM2.5 concentrations, this study used PM2.5 Air Quality Index (AQI) categories for 24-hour exposure (Figure 7). The AQI indicates the air quality in an area and its corresponding health cautionary statements (US EPA, 2018). Since there are currently no PM2.5 AQI categories in the Philippines, the computations were based on the US EPA regulations for PM2.5 AQI:
Where
CP = PM2.5 concentration
BPHI = concentration breakpoint that is ≥ to CP
BPLO = concentration breakpoint that is ≤ to CP
IHI = the AQI value corresponding to BPHI
ILO = the AQI value corresponding to BPLO
The US EPA AQI scale describes each category with colors and the AQI value. For instance, when the PM2.5 concentration at a specified site has an AQI value above 100, an orange warning cautions people with heart and/or lung conditions, children, and other members of vulnerable populations against increased health risks.
The 24-hour averaged PM2.5 concentrations revealed a slight increase (up to 57%) in most sites during the 2023 New Year’s event with the air quality index reaching unhealthy levels.
PM2.5 samples were collected on Teflon filters from 12:00 P.M. on December 31, 2022 to 12:00 PM on January 1, 2023, using MiniVol TAS samplers that have a flow rate of 5 liters min-1. Figure 2 shows that PM2.5 samples collected from 2003 until 2016 in the majority of Metro Manila sites reached “hazardous” levels. This means that during those New Year’s Eve events, it is recommended for everyone to stay indoors and avoid outdoor exposure, especially for people with respiratory and heart conditions. However, with the strict implementation of the firecracker ban (Executive Order No. 28) in 2017, the PM2.5 concentrations decreased up to five-fold compared to the first decade of New Year’s Eve monitoring.
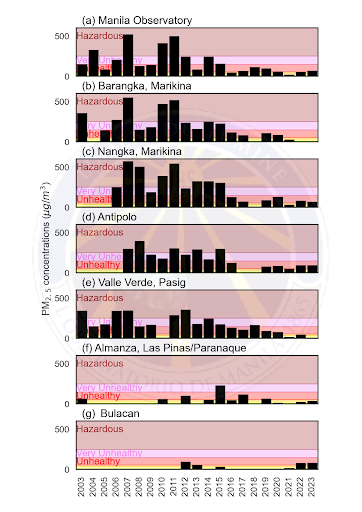
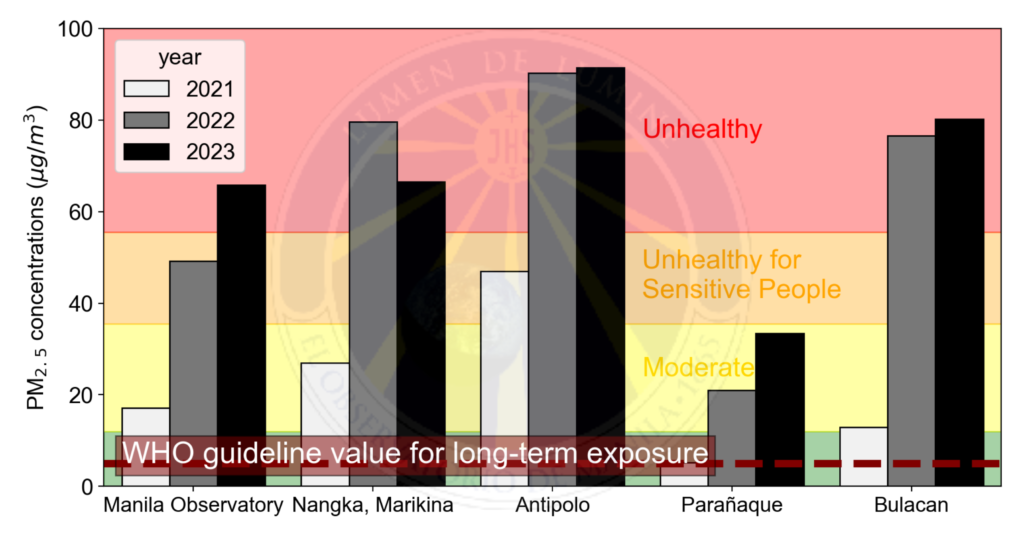
The sudden decline in PM2.5 levels during the 2021 NYE, shown in Figure 2, also highlights the impact of the pandemic’s strict lockdown measures. This year’s NYE measurements showed a slight increase in PM2.5 levels in the majority of the sampling sites compared to 2022 NYE values (Figure 3). However, PM2.5 levels decreased by 18% in Nangka, Marikina. The apparent changes in the NYE PM2.5 levels reflect the “return to normal” activities since there were no COVID-19-related restrictions. People can go out and gather for events more easily, i.e. giving them access to vacation trips with less stringent health protocols.
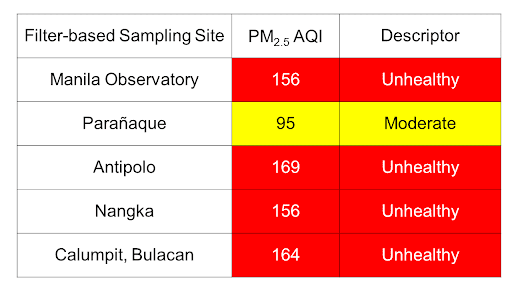
The largest increase in PM2.5 levels was recorded in Parañaque (about 57%) and Manila Observatory (about 35%) among the five sites, followed by a minimal increase in Antipolo (about 1%). The observed increase over Manila Observatory (Figure 3) led to a shift in AQI from previously “unhealthy for sensitive groups” in NYE 2022 to “unhealthy” levels in NYE 2023 (AQI level = 156). Similarly, the AQI in Antipolo (169), Nangka (156), and Calumpit, Bulacan (164) reached “unhealthy levels” which denoted that everyone, including healthy adults, should minimize heavy exposure to outdoor particulate pollution. The AQI in Parañaque remained in the moderate range (95) as shown in the three-year PM2.5 levels of the city (Figure 3). This means that the air quality is generally acceptable but may pose some risks to members of vulnerable groups. Figure 3 also shows that the AQI in Calumpit, Bulacan persisted in the “unhealthy” levels (164), although the previous two-year measurements were done in a different locality (San Jose del Monte). It should be noted that the 2021 and 2022 (San Jose del Monte) and 2023 (Calumpit) sites in Bulacan are both residential areas.
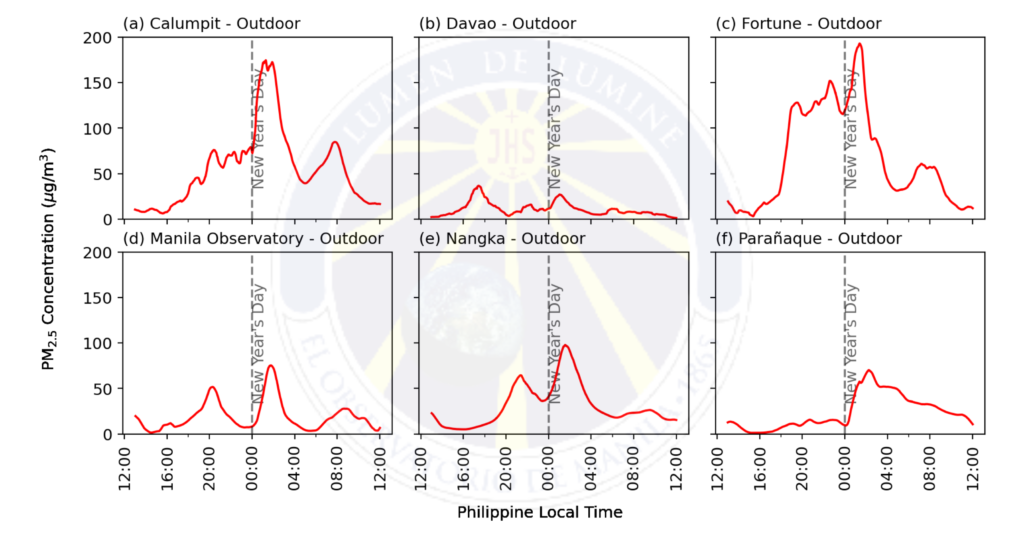
The real-time PM2.5 concentrations have reached more than 150 μg/m3 for Fortune, Marikina and Calumpit, Bulacan after midnight which signifies the lighting of the firecrackers.
The AS-Lung personal samplers were used to monitor the PM2.5 concentrations in real-time. Figure 4 shows the hourly rolling average from 12:00 P.M. on December 31, 2022 to 12:00 PM on January 1, 2023, of the 15 seconds interval collected by the personal samplers. The Metro Manila sites showed elevated PM2.5 concentrations for approximately 3 to 4 hours after 12:00 A.M of New Year. Fortune and Calumpit sites showed elevated PM2.5 concentrations of more than 150 μg/m3 after midnight which signifies the lighting of the firecrackers. Nangka, Manila Observatory, and Parañaque also showed elevated concentrations after midnight (of less than 100 μg/m3). Only the Davao site showed the least amount of PM2.5 concentrations, which is attributed to the stricter implementation of the firecracker ban. Moreover, the initial elevated PM2.5 concentrations observed before midnight of New Year may be attributed to residential cooking for Media Noche and the early fireworks display.
Meteorological Conditions during NYE celebration
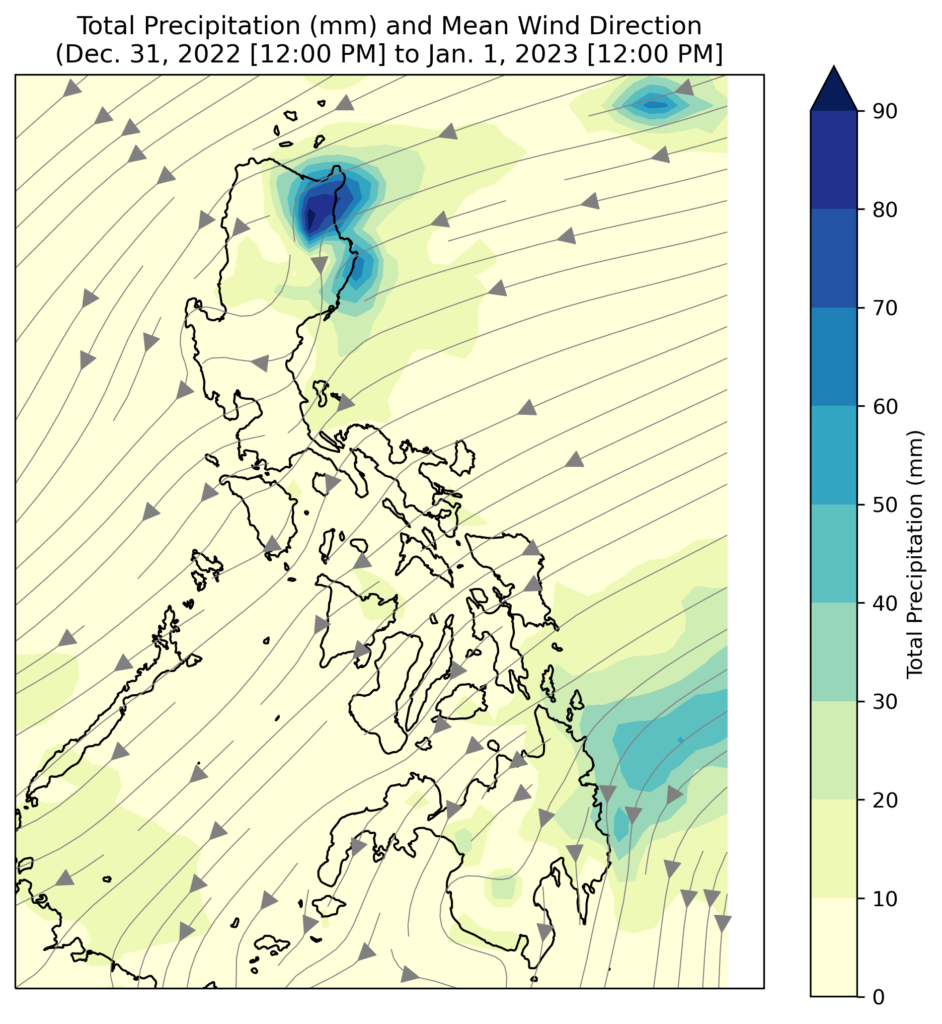
The meteorological conditions during the New Year’s Eve celebrations were estimated using the hourly ERA5 Reanalysis Data (with 0.25° x 0.25° resolution) since there were no complete ground observations from the automated weather stations. Ten-meter surface winds (meters) and daily total precipitation (mm) were obtained and calculated from the nearest ERA5 gridpoint to each MiniVol sampling site described and shown in Figure 1.
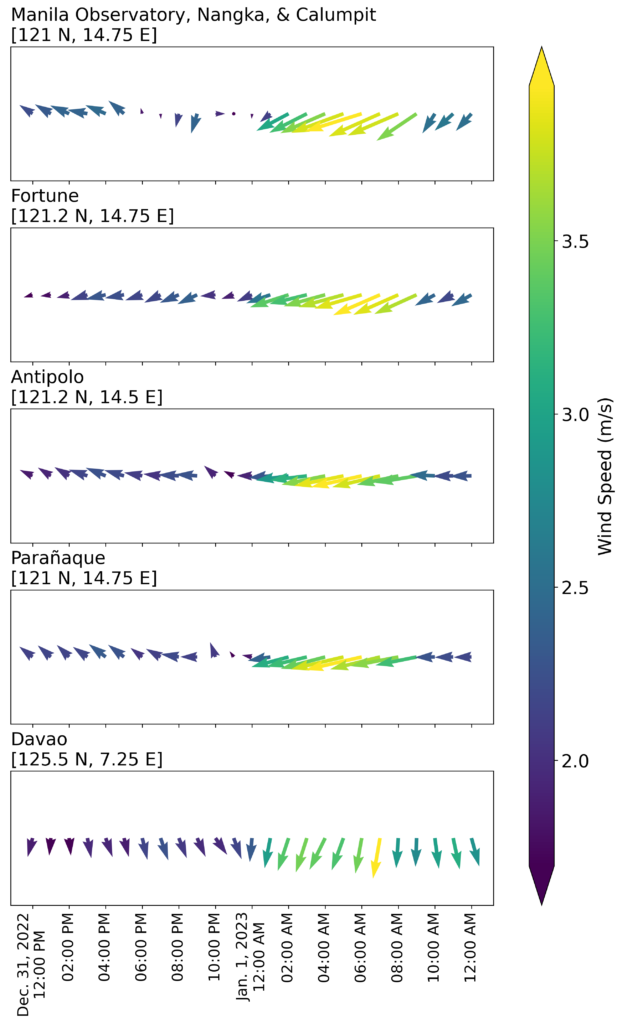
The estimated wind speed and direction profile are shown in Figure 6. Due to the spatial resolution of the dataset, the extracted hourly winds for some sampling sites may be from a similar gridpoint. The exact longitude and latitude of the representative ERA5 gridpoint for each sampling site are also indicated in the figure.
The transport and dry deposition of firework-related pollutants will highly depend on the meteorological conditions, such that higher wind speeds will disperse the air pollutants faster than lower wind speeds. Lower wind speeds were observed from 12 P.M. on December 31, 2022 to 12 A.M. (midnight) on January 1, 2023 with winds coming from the southeast for Metro Manila sites, then an increased wind speed and change of direction to the northeast were observed after midnight. Additionally, a much lower wind speed was observed in Davao with wind directions coming from the north from 12:00 P.M. on December 31 to 12:00 A.M. on January 1, then a slight increase and change of direction from the northeast were observed from 1:00 A.M. to 12:00 P.M of January 1. There are no conclusive meteorological effects based on currently available information since ERA5 has varying performance in terms of capturing hourly 10-m wind speeds depending on location (Molina et al., 2021).
Appendix
References:
- AirNow. Air Quality Index (AQI) Basics. Retrieved from: https://www.airnow.gov/aqi/aqi-basics/
- Echegoyen, C.K, Fajermo, E., & Rodriguez, N.A. (2022). Fireworks manufacturers reel from high prices, and stricter regulations. Retrieved from https://varsitarian.net/special-reports/20221221/fireworks-manufacturers-reel-from-high-prices-stricter-regulations
- Greven, F., Vonk, J., Fischer, P., Duijm, F., Vink, N., & Brunekreef, B. (2019). Air pollution during New Year’s fireworks and daily mortality in the Netherlands. Scientific Reports, 9(1). doi: 10.1038/s41598-019-42080-6
- Lazaro, R. (2023). Bulacan fireworks prices increase. Retrieved from https://www.philstar.com/nation/2022/11/27/2226695/bulacan-fireworks-prices-increase
- Lorenzo, G. R., Bañaga, P. A., Cambaliza, M. O., Cruz, M. T., AzadiAghdam, M., Arellano, A., Betito, G., Braun, R., Corral, A. F., Dadashazar, H., Edwards, E.-L., Eloranta, E., Holz, R., Leung, G., Ma, L., MacDonald, A. B., Reid, J. S., Simpas, J. B., Stahl, C., … Sorooshian, A. (2021). Measurement report: Firework impacts on air quality in Metro Manila, Philippines, during the 2019 New Year revelry. Atmospheric Chemistry and Physics, 21(8), 6155–6173. https://doi.org/10.5194/acp-21-6155-2021
- Met One Instrument. A Case Study Using the Met One Instruments, Inc. BAM 1020 During Wildfire Season. Retrieved from: https://metone.com/how-to-calculate-aqi-and-nowcast-indices/
- Montemayor, M.T., (2023). DOH reports 277 fireworks-related injuries as of Jan. 4. Retrieved from https://www.pna.gov.ph/articles/1191977
- Molina, M. O., Gutiérrez, C., & Sánchez, E. (2021). Comparison of ERA5 surface wind speed climatologies over Europe with observations from the HadISD dataset. International Journal of Climatology, 41(10), 4864–4878. https://doi.org/10.1002/joc.7103
- Monzon, A. (2022, Dec 31). Fireworks, ’cracker prices up but stores still enjoy brisk business. Inquirer. https://newsinfo.inquirer.net/1710770/fireworks-cracker-prices-up-but-stores-still-enjoy-brisk-business
- Ong, G. (2022, December 27). Quezon City bans households from holding fireworks displays. The Philippine Star. https://www.philstar.com/nation/2022/12/27/2233438/quezon-city-bans-households-holding-fireworks-displays
- Singh, A., Pant, P., & Pope, F. (2019). Air quality during and after festivals: Aerosol concentrations, composition and health effects. Atmospheric Research, 227, 220-232. doi: 10.1016/j.atmosres.2019.05.012
- Tanda, S., Ličbinský, R., Hegrová, J., & Goessler, W. (2019). Impact of New Year’s Eve fireworks on the size-resolved element distributions in airborne particles. Environment International, 128, 371-378. doi: 10.1016/j.envint.2019.04.071
- U.S. Environmental Protection Agency. (2018). Technical Assistance Document for the Reporting of Daily Air Quality – the Air Quality Index. https://www.airnow.gov/sites/default/files/2020-05/aqi-technical-assistance-document-sept2018.pdf