by Mariane Desiree Avendaño, Zenn Marie Cainglet, Ophel Eliza Rabaja, Paola Banaga, Melliza Templonuevo Cruz, James B. Simpas, Maria Obiminda Cambaliza, Fr. Jose Ramon Villarin, SJ, and Fr. Daniel McNamara, SJ
New Year’s Day is a global celebration marking the passage of time accompanied by explosive sounds and colorful fireworks displays. Pyrotechnic spectacles are an integral part of the festivities across many cultures. For some, fireworks serve as expressions of joy and excitement, while for others, they hold a deeper spiritual significance, such as driving away bad luck and spirits for a fresh start. Regardless of their festive appeal and meaning, however, fireworks pose significant risks to human health and safety.
This year, the Department of Health (DOH) reported 843 firework-related acute injuries, reflecting a 38% increase from last year’s tally (Flores, 2025). In addition, the DOH issued warnings about health risks associated with continuous high-level exposure to fireworks including a variety of cardiovascular complications: chronic or allergic bronchitis, bronchial asthma, sinusitis, rhinitis, pneumonia, and laryngitis. These risks can be attributed to certain chemical and particulate components of fireworks. Pyrotechnics contain metals that create their vivid colors, gunpowder as fuel, and oxidizers that support combustion. Together, these substances contribute to a surge in suspended particulate matter during New Year’s festivities.
Particulate matter (PM) consists of microscopic solid particles and liquid droplets suspended in the air (United States Environmental Protection Agency, 2023). PM is categorized by particle size, with PM2.5 referring to particulates with diameters of 2.5 micrometers or less. The US EPA published an Air Quality Index (AQI) which serves as a tool for determining the level of health concern based on PM2.5 concentrations. According to this standard, for a 24-hour exposure time, PM2.5 levels between 0-12 micrograms per cubic meter (µg/m3) are considered satisfactory, concentrations between 55.5 and 150.4 µg/m3 are unhealthy, and anything above 250.5 µg/m3 is deemed hazardous.
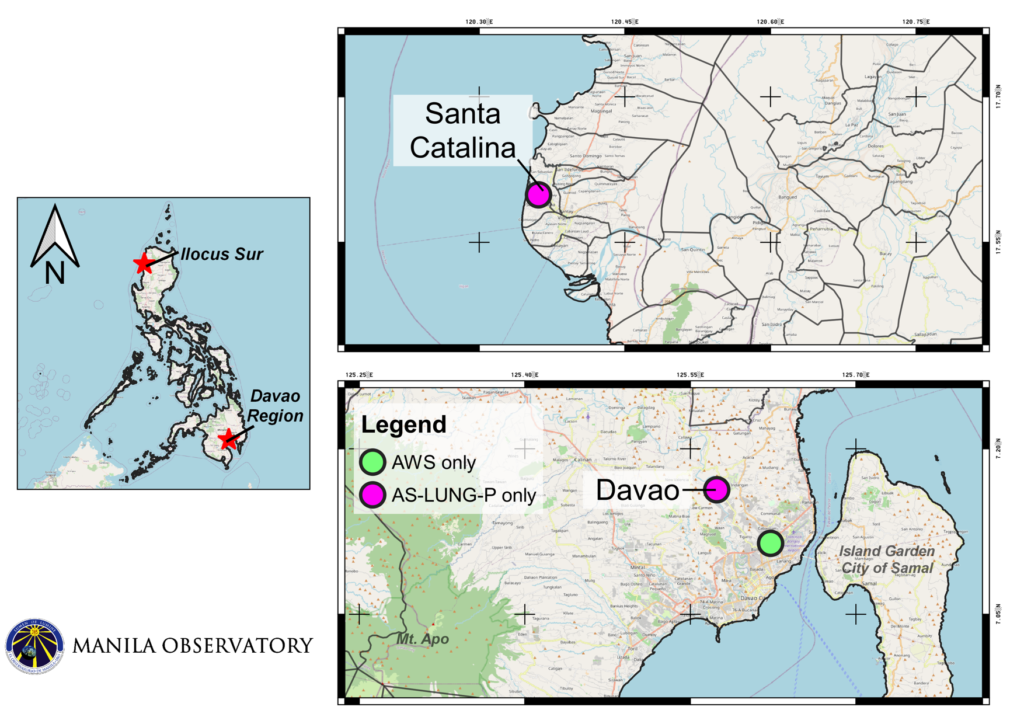
In Metro Manila, common sources of PM2.5 include vehicular traffic, construction activities, sea salt, road dust, waste management, and biomass burning (Simpas et al., 2014; Cruz et al., 2019). During New Year’s celebrations, fireworks contribute significantly to PM2.5 levels. Thus, the Manila Observatory has been monitoring and reporting air quality through PM2.5 concentrations annually for the past two decades. In 2025, the Observatory deployed Teflon-filter-based MiniVol samplers and AS-LUNG outdoor and personal sampler instruments at various locations. MiniVol samplers conducted 24-hour sampling in Antipolo, Rizal; Calumpit, Bulacan; Katipunan, Quezon City; Nangka, Marikina City; Parañaque City; and Kaimito, Pasig (Valle Verde). The AS-LUNG instruments recorded real-time data in Davao City, Davao del Sur; Fortune, Marikina City; San Jose del Monte (SJDM), Bulacan; Santa Catalina, Ilocos Sur; and Tandang Sora, Quezon City, in addition to the MiniVol sampler sites. Figure 1 summarizes these sampling locations.

(a)
(b)
Figure 1. PM2.5 filter-based and continuous sampling measurement locations (a) within the Greater Manila Area and (b) in other regions during New Year 2025.
Twenty-Four Hour PM2.5 Concentrations
The PM2.5 concentrations recorded by the MiniVol samplers varied depending on the location. As shown in Figure 2, unhealthy PM2.5 levels were recorded in Kaimito, Pasig (123 µg/m3); Antipolo, Rizal (106.2 µg/m3); Katipunan, Quezon City (87.4 µg/m3); and Nangka, Marikina City (82.2 µg/m3). These sites were also reported to have unhealthy concentrations in 2024. All except the site in Nangka had an observed increase in concentrations. The Kaimito, Antipolo, and Katipunan sites observed 13%, 36%, and 10% increases in PM2.5 concentrations, respectively, while Nangka observed a 19% decrease.
Conversely, Parañaque City (37.8 µg/m3) and Calumpit, Bulacan (37.3 µg/m3) reported unhealthy levels only for sensitive people. The air quality in the former worsened (increased by 432%) while the latter improved significantly (decreased by 72%) compared to the previous year.
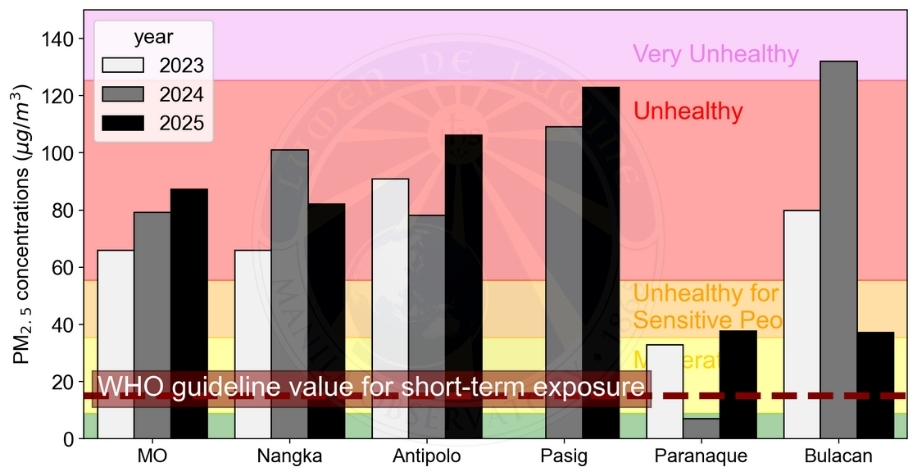
Figure 2. New Year PM2.5 concentrations for 2023, 2024, and 2025 overlaid with the US EPA’s Air Quality Index (AQI) for 24-hour PM2.5 concentrations. For reference, the WHO 24-hour guideline value is also indicated as a red broken line in the figure.
Figure 3 shows the PM2.5 concentrations over the past two decades. Evidently, the current decade (2016-2025) shows significantly lower concentrations compared to the previous decade (2006-2015). The Manila Observatory site had an average concentration of 258.6 µg/m3 from 2006 to 2015 which dropped to only 66.5 µg/m3 from 2016 to 2025. The Nangka site also saw a reduction from an average of 359.3 µg/m3 (2006-2015) to 84.2 µg/m3 from 2016 to 2025. These represent decreases of 74% and 76%, respectively, which could be related to the DOH’s campaign against fireworks, the PNP’s anti-illegal firecracker drive beginning in 2015, former president Rodrigo Duterte’s Executive Order limiting the use of fireworks to community displays in 2017, and the total ban on fireworks in 2020. These efforts have likely reduced public reliance on firecrackers and encouraged alternative celebratory methods.


Figure 3. Long-term New Year PM2.5 concentrations from 2003 to 2025 overlaid with the US EPA’s Air Quality Index (AQI) for 24-hour PM2.5 concentrations.
Real-Time PM2.5 Concentrations
The AS-LUNG personal sampler instruments measure particulate matter concentrations at a higher resolution (every 15 seconds), providing more insight to individuals’ acute exposure to pollution. Figure 4 shows the real-time PM2.5 concentrations for all sampling sites in 2025 from noontime of December 31, 2024 to noontime of January 1, 2025.

Figure 4. Real-time PM2.5 concentrations for New Year 2025 from noontime of December 31, 2024 to noontime of January 1, 2025.
Various patterns in PM2.5 concentration elevation can be observed. For Antipolo, Fortune, and Tandang Sora, three peaks with elevated concentrations were seen, albeit with different intensities. Two distinguishable but less intense peaks were observed before (between 19:30 and 22:30) and after (between 7:30 and 9:30) midnight. The highest peaks were observed shortly after midnight, with concentrations of 373 µg/m3, 260 µg/m3, and 225 µg/m3 for Antipolo, Fortune, and Tandang Sora, respectively. These concentrations are all classified as alarmingly unhealthy levels and can be attributed to the increased number of firework explosions and emissions from revving up motorcycles or cars to produce noise near midnight. At this time, it is recommended that people in the area wear appropriate personal protective equipment such as air-filtering masks to avoid inhaling the particle pollution.
The most intense PM2.5 concentration levels were reported in the SJDM, Bulacan site. Two peaks were observed at around 20:50 (748 µg/m3) on December 31, 2024 and 00:30 (372 µg/m3) on January 1, 2025. These can be attributed to emissions from firecrackers, vehicle exhausts, and grilling near the times when Media Noche is prepared and when the celebration proper takes place. The Santa Catalina site also appears to have peaks at the same time but at lower intensities. It can be inferred that there are less pollution sources in this area.
The Manila Observatory and Nangka sites demonstrated a unique pattern. A wide envelope of gradually increasing concentrations were observed. The PM2.5 concentrations started increasing in the early evening of December 31 while the peak concentrations were observed after midnight of January 1. For the Manila Observatory, an urban mixed site, it is likely that the PM2.5 from the fireworks and vehicles took more time to be advected to the site, resulting in a seeming delay in the increase of concentrations.
Indoor and Outdoor Air Quality in Nangka, Marikina City
Indoor and outdoor PM2.5 readings were taken concurrently at Nangka, Marikina City to evaluate the risks of particulate pollution entering households. There was no interior human activity noted during the sample period, hence making the indoor measurements a trustworthy value for comparison. Figure 5 shows the indoor and outdoor PM2.5 concentrations obtained from the sampling site.

Figure 5. Real-time indoor and outdoor PM2.5 concentrations in Nangka, Marikina City for New Year 2025.
The general trends of the indoor and outdoor PM2.5 concentrations are the same. It is seen to begin increasing in the early evening, reach its peak shortly after midnight, and steadily decrease afterwards. The outdoor concentrations are slightly more elevated than the indoor concentrations since most PM2.5 sources are located outdoors. It can be observed, however, that it also takes a relatively long time for the PM2.5 concentrations indoors to decrease. The slow rate can be attributed to poor ventilation causing the pollutants to stay inside over time.
Meteorological Conditions during the New Year Celebration
Eight automated weather stations (AWS) were operational in gathering wind direction and wind speed data during the New Year’s Eve celebrations. These stations were located at: (1) Manila Observatory, (2) Nangka, (3) Paranaque, (4) Pasig, (5) Brgy. Holy Spirit, (6) Antipolo, (7) Calumpit, and (8) Davao.
Generally, high wind speeds were observed in the afternoon (between 12 PM and 4 PM) on December 31, followed by less to no winds during midnight. However, the Calumpit site was an exception, as it recorded relatively high wind speeds during midnight. This may have contributed to the lower PM2.5 concentrations observed compared to the previous year.
Manila Observatory and Brgy. Holy Spirit reported 0.6 mm and 0.4 mm of rainfall between 1 AM and 2 AM, respectively. Antipolo accumulated 1.2 mm from 12 AM to 2 AM while Parañaque reported 0.6 mm at 12 AM. Davao experienced more significant rainfall, with 5.4 mm at 11 PM and 1.2 mm at 12 AM. However, the rainfall was insufficient to clear firework particles from the atmosphere, and the low wind speeds contributed to the elevated PM2.5 concentrations during the New Year’s Eve event.

Figure 6. Wind speed and direction in (1) Manila Observatory, (2) Nangka, (3) Paranaque, (4) Pasig, (5) Brgy. Holy Spirit, (6) Antipolo, (7) Calumpit, and (8) Davao. Each subplot shows wind speed vectors with different colors representing different wind speeds, as indicated by the color bar. The wind speed vectors indicate both the speed and direction of the wind at each location.
The surface wind profiles (10-meter) for the other sites were estimated using the ERA5-Land hourly data (0.1° x 0.1° resolution) by calculating the nearest ERA5 gridpoint to each PM2.5 sampling site, as shown in Figure 7.

Figure 7. Estimated wind speed data from ERA5-Land hourly data in Manila Observatory, Nangka, Fortune, Parañaque, Pasig, Tandang Sora, Antipolo, Calumpit, San Jose del Monte, Davao, and Santa Catalina. Each subplot shows wind speed vectors with different colors representing different wind speeds. The wind speed vectors indicate both the speed and direction of the wind at each location.
As shown in Figure 8, the Philippines generally experienced northeasterly winds (Amihan) with relatively low wind speeds between 1 and 3 m/s. The wind direction remained relatively consistent throughout the sampling in the Greater Manila Area. Similar to the AWS reports, most sites experienced relatively high wind speeds in the afternoon, which decreased in the evening leading up to the New Year’s Eve celebration. Lower wind speeds typically occurred between 10 PM and 9 AM, with an average of 1.5 m/s. These low wind speeds hindered the dispersion of firework particles, contributing to higher PM2.5 concentrations.
Provincial areas such as Davao and Santa Catalina showed distinct wind patterns. Davao showed a general northeast wind pattern with fluctuating wind speeds, while Santa Catalina experienced a more consistent wind pattern, blowing from the northwest in the afternoon and shifting to the northeast during the New Year’s Eve celebration. Compared to the Greater Manila Area, Davao has the strictest regulations on fireworks activities, which also likely contributed to the lower PM2.5 concentrations.


Figure 8. Mean wind speed and direction from ERA5 Reanalysis Data and total precipitation from Weather Research and Forecasting (WRF) (5-km resolution).
The annual observed PM2.5 concentrations during New Year celebrations are influenced by political and meteorological factors. The current decade (2016-2025) has reported lower PM2.5 levels compared to the previous decade (2006-2015). However, unhealthy PM2.5 levels were still recorded at several sampling locations, led by Kaimito, Pasig (123 µg/m³), Antipolo, Rizal (106.2 µg/m³), Katipunan, Quezon City (87.4 µg/m³), and Nangka, Marikina City (82.2 µg/m³). The highest peaks are typically observed shortly after midnight which can be attributed to firecrackers and vehicular exhausts. Despite the stricter policies on the use of pyrotechnics, it is still crucial for the public to be aware of safety measures to protect against PM2.5 exposure during New Year celebrations.
References
Cruz, M. T., Bañaga, P. A., Betito, G., Braun, R. A., Stahl, C., Aghdam, M. A., Cambaliza, M. O., Dadashazar, H., Hilario, M. R., Lorenzo, G. R., Ma, L., MacDonald, A. B., Pabroa, P. C., Yee, J. R., Simpas, J. B., & Sorooshian, A. (2019). Size-resolved composition and morphology of particulate matter during the southwest monsoon in Metro Manila, Philippines. Atmospheric Chemistry and Physics, 19(16), 10675–10696. https://doi.org/10.5194/acp-19-10675-2019
Flores, D. N. (2025, January 6). DOH: 843 hurt by fireworks, 38% higher than 2024. Philippine Star. Retrieved from https://www.philstar.com/headlines/2025/01/06/2412254/doh-843-hurt-fireworks-38-higher-2024.
Department of Health. (n.d.). What are the health effects of using fireworks/firecrackers? Retrieved from https://doh.gov.ph/faqs/What-are-the-health-effects-of-using-fireworks/firecrackers#:~:text=Increase%20in%20the%20sound%20levels,%2C%20rhinitis%2C%20pneumonia%20and%20laryngitis.
Simpas, J., Lorenzo, G., & Cruz, M. T. (2014). Monitoring particulate matter levels and composition for source apportionment study in Metro Manila, Philippines. In N. T. Kim Oanh (Ed.), Improving Air Quality in Asian Developing Countries: Compilation of Research Findings (pp. 239–261). NARENCA, Vietnam Publishing House of Natural Resources, Environment and Cartography, Vietnam.