By: Zenn Marie Cainglet, Aubrey May De Francisca, Shane Marie Visaga, Jarl Tynan Collado, Xzann Gary Vincent Topacio, Paola Bañaga, Grace Betito, Maria Obiminda Cambaliza, James Bernard Simpas, Genevieve Rose Lorenzo, Melliza Cruz, Fr. Jose Ramon Villarin, SJ, and Fr. Daniel McNamara, SJ
Summary:
- Filter-based 24-hour averaged PM2.5 concentrations revealed higher levels this year compared to last year’s New Year measurements.
- Real-time PM2.5 measurements reached unhealthy levels (139 – 351 µg/m3) in four sites during the New Year’s Eve celebrations.
- Low wind speeds observed from 09:00 p.m. 31 December to 06:00 a.m. 1 January for most weather stations in Metro Manila, may have possibly contributed to the stagnation of PM2.5 concentrations in each site.
Introduction
Filipinos celebrated the 2022 New Year’s Eve (NYE) with a less stringent lockdown protocol compared to last year amid the continuing threat of COVID-19. Despite the emergence of the Omicron variant, Metro Manila and other major cities in the country were placed under Alert Level 2 over the holidays. This means that economic activities, including small-crowd gatherings, were allowed especially for fully vaccinated individuals. However, with the passing of Executive Order No. 28 which regulated the use of fireworks in the country, the traditional New Year’s Eve revelries have been curtailed. This has resulted in an overall decline in firework-related incidents compared to previous years, although 58% of the reported victims were just bystanders (Department of Health, 2022). Aside from the risks for accidents and physical injuries, the lighting of fireworks and firecrackers produces thick smoke which results in poor air quality, reduced visibility, and consequently adverse health outcomes (Ambade, 2018). Setting off fireworks aggravates air pollution by releasing significant amounts of harmful gases such as sulfur dioxide (SO2), nitrogen oxides (NOx), particulate matter (PM), and water-soluble ions and metals such as manganese and aluminum into the atmosphere (Greven et. al, 2019; Zhang, 2020). For example, during the 2019 New Year’s Eve, it was recorded that fine PM concentrations (PM2.5 or PM with an aerodynamic diameter of 2.5 micrometers or less) peaked at 383.9 µg/m3 (a level categorized as hazardous), concentrations of inorganic species such as lead and manganese increased twofold at the height of firework events, and surface aerosol layer has thickened for 8 hours (Lorenzo et. al, 2021).
Among many firework-emitted pollutants, exposure to PM2.5 has been a global public health concern because it is directly linked to a wide range of respiratory and cardiovascular diseases (Hime, 2018). PM2.5 is about 30 times smaller than the diameter of a strand of a human hair – tiny enough to penetrate deep into our lungs, enter the bloodstream, and cause damage to blood circulation and the immune system (Dockery et al., 1993; Pope et al., 2020; Zhang, 2020). It should be noted that although firework events are short-lived, their PM2.5 emissions can remain in the atmosphere for days, thus posing more significant health risks, especially for children and people with underlying respiratory conditions (Do et al., 2012).
Reflecting the need for local air pollution assessments, especially in times of extreme pollution events, the Manila Observatory has been monitoring PM2.5 concentrations during New Year’s Eve celebrations since 1998. Several PM samplers, both filter-based and continuous real-time samplers, were deployed across Metro Manila and nearby locations this year. PM2.5 samples were collected on pre-conditioned Teflon filters (47-mm diameter, 2-μm pore size) using MiniVol Tactical Air Samplers (TAS) at a constant flow rate of 5 L/min. As indicated in Figs. 1 and A1, MiniVol TAS were deployed in six sampling sites: (1) Manila Observatory, Quezon City; (2) Nangka, Marikina; (3) Mambugan, Antipolo; (4) Valle Verde, Ugong, Pasig; (5) South Bay Gardens, BF Homes, Parañaque; and (6) Muzon, San Jose del Monte, Bulacan. The battery-operated portable samplers were scheduled to run from 12:00 p.m. of 31 December 2021 to 12:00 p.m. of 1 January 2022. After the 24-hour particle collection, the samples were analyzed gravimetrically for their masses. Real-time PM2.5 measurements were also collected to complement the filter-based analysis using the Academia Sinica (AS-LUNG) personal samplers in seven sites: (1) Mambugan, Antipolo; (2) Valle Verde, Ugong, Pasig; (3) South Bay Gardens, BF Homes, Parañaque; (4) Muzon, San Jose del Monte, Bulacan, (5) Batasan Hills, Quezon City; (6) Fortune, Marikina; and (7) Nangka, Marikina. This laser-based instrument determines PM2.5 mass concentrations every 15 seconds; hence, it is capable of assessing exposure levels to episodic pollution events (Lung et. al, 2020). In addition to the real-time PM2.5 measurements, an Environmental Beta Attenuation Monitor (E-BAM) was used and situated on the roof deck of the Ionosphere building of the Manila Observatory (~70 m.a.s.l.). The E-BAM measures the PM2.5 mass deposited on a beta-irradiated filter tape that advances mechanically every hour. Moreover, 6 available automated weather stations (AWS) were used to record the wind profile during the NYE celebrations. Two out of six AWS used were from Davis Instruments located in Manila Observatory and Nangka, and the rest were from Lufft Instruments deployed in different SM malls.

Figure 1. Filter-based and real-time Particulate matter (PM) sampling locations for New Year 2022. The legend indicates the type of instrument used for each site. MiniVol samplers for filter-based 24-hour sampling were deployed in six sampling sites: (1) Manila Observatory, Quezon City; (2) Nangka, Marikina; (3) Mambugan, Antipolo; (4) Valle Verde, Ugong, Pasig; (5) South Bay Gardens, BF Homes, Parañaque; and (6) Muzon, San Jose del Monte, Bulacan. AS-Lung personal samplers for real-time continuous sampling were installed at seven sites: (1) Mambugan, Antipolo; (2) Valle Verde, Ugong, Pasig; (3) South Bay Gardens, BF Homes, Parañaque; (4) Muzon, San Jose del Monte, Bulacan, (5) Batasan Hills, Quezon City; (6) Fortune, Marikina; and (7) Nangka, Marikina. Automated Weather Stations (AWS) were deployed in seven sites: (1) Manila Observatory; (2) Nangka, Marikina; (3) SM Marikina; (4) SM Masinag; (5) SM Megamall; (6) SM Pasig; (7) SM BF Homes Parañaque…
Air pollution is one of the greatest environmental risks to human health, especially for low and middle-income countries (WHO, 2021). Hence, it becomes increasingly relevant to look at the health implications of the observed particle pollution levels. As in the prior reports, PM2.5 concentrations were plotted over the United States Environmental Protection Agency (US EPA) Air Quality Index (AQI) categories. Each AQI category corresponds to pollution-specific health risks and provides preventive measures people can do to reduce their exposure to air pollution. Table 1 shows the US EPA AQI for 24 hours, while Table 2 shows the US EPA AQI for hourly PM2.5 concentration.
Results:
Filter-based 24-hour averaged PM2.5 concentrations revealed higher levels this year compared to last year’s New Year measurements
PM2.5 concentrations increased significantly from last year to this year, reaching “moderate” to “unhealthy” levels for some sampling sites (Figure 2). The steep increase in PM2.5 levels was observed in San Jose del Monte Bulacan (6 times higher), followed by Paranaque (4 times higher), in Manila Observatory, Valle Verde, Pasig, and in Nangka, Marikina (3 times higher), and in Antipolo (twice higher). Figure 2 also shows that for most sampling sites, PM2.5 levels during NYE have improved fairly since 2015 and even more so in 2021 — indicating the impacts of COVID-19 lockdown on significant sources of air pollution (Ravindra et. al, 2021). In the 2021 NYE report, the absence of major activities like mass gatherings and transportation resulted in the decline of PM2.5 concentrations. Hence, we expect a parallel increase in pollution levels once community quarantine protocols become lenient and economic activities resume normal. Moreover, the proximity of the samplers to emission sources such as grillers and firecrackers can also be considered as a factor in the current PM2.5 measurement levels. Three out of the seven sampling sites qualified at “unhealthy” levels: Nangka, Marikina (80 µg/m³), Antipolo, Rizal (90 µg/m³), and San Jose del Monte, Bulacan (77 µg/m³). This implies that even healthy adults may experience health effects, while children, elderly people, and other vulnerable individuals are at greater risk of serious health hazards.

Figure 2. Twenty-four hour average PM2.5 concentrations (µg/m³) during New Year’s from 2003 to 2022. Samples were collected from 12 p.m. 31 December to 12 p.m. 1 January using portable MiniVol samplers at the following sites: (a) Manila Observatory, (b) Barangka, Marikina, (c)Nangka, Marikina, (d) Antipolo, (e) Valle Verde, Pasig, (f) Almanza, Las Piñas/Parañaque, and (g) Calumpit, Bulacan. ..
The increase in PM2.5 concentrations is evident in the filter samples from different locations as shown in Figure 3. New Year 2022 has darker deposits as compared to the New Year 2021 samples.

Figure 3. . Images of filter samples during the New Year 2022 (top) and 2021 (bottom).
Real-time PM2.5 measurements reached unhealthy AQI levels in four sites during the New Year Eve’s celebrations.
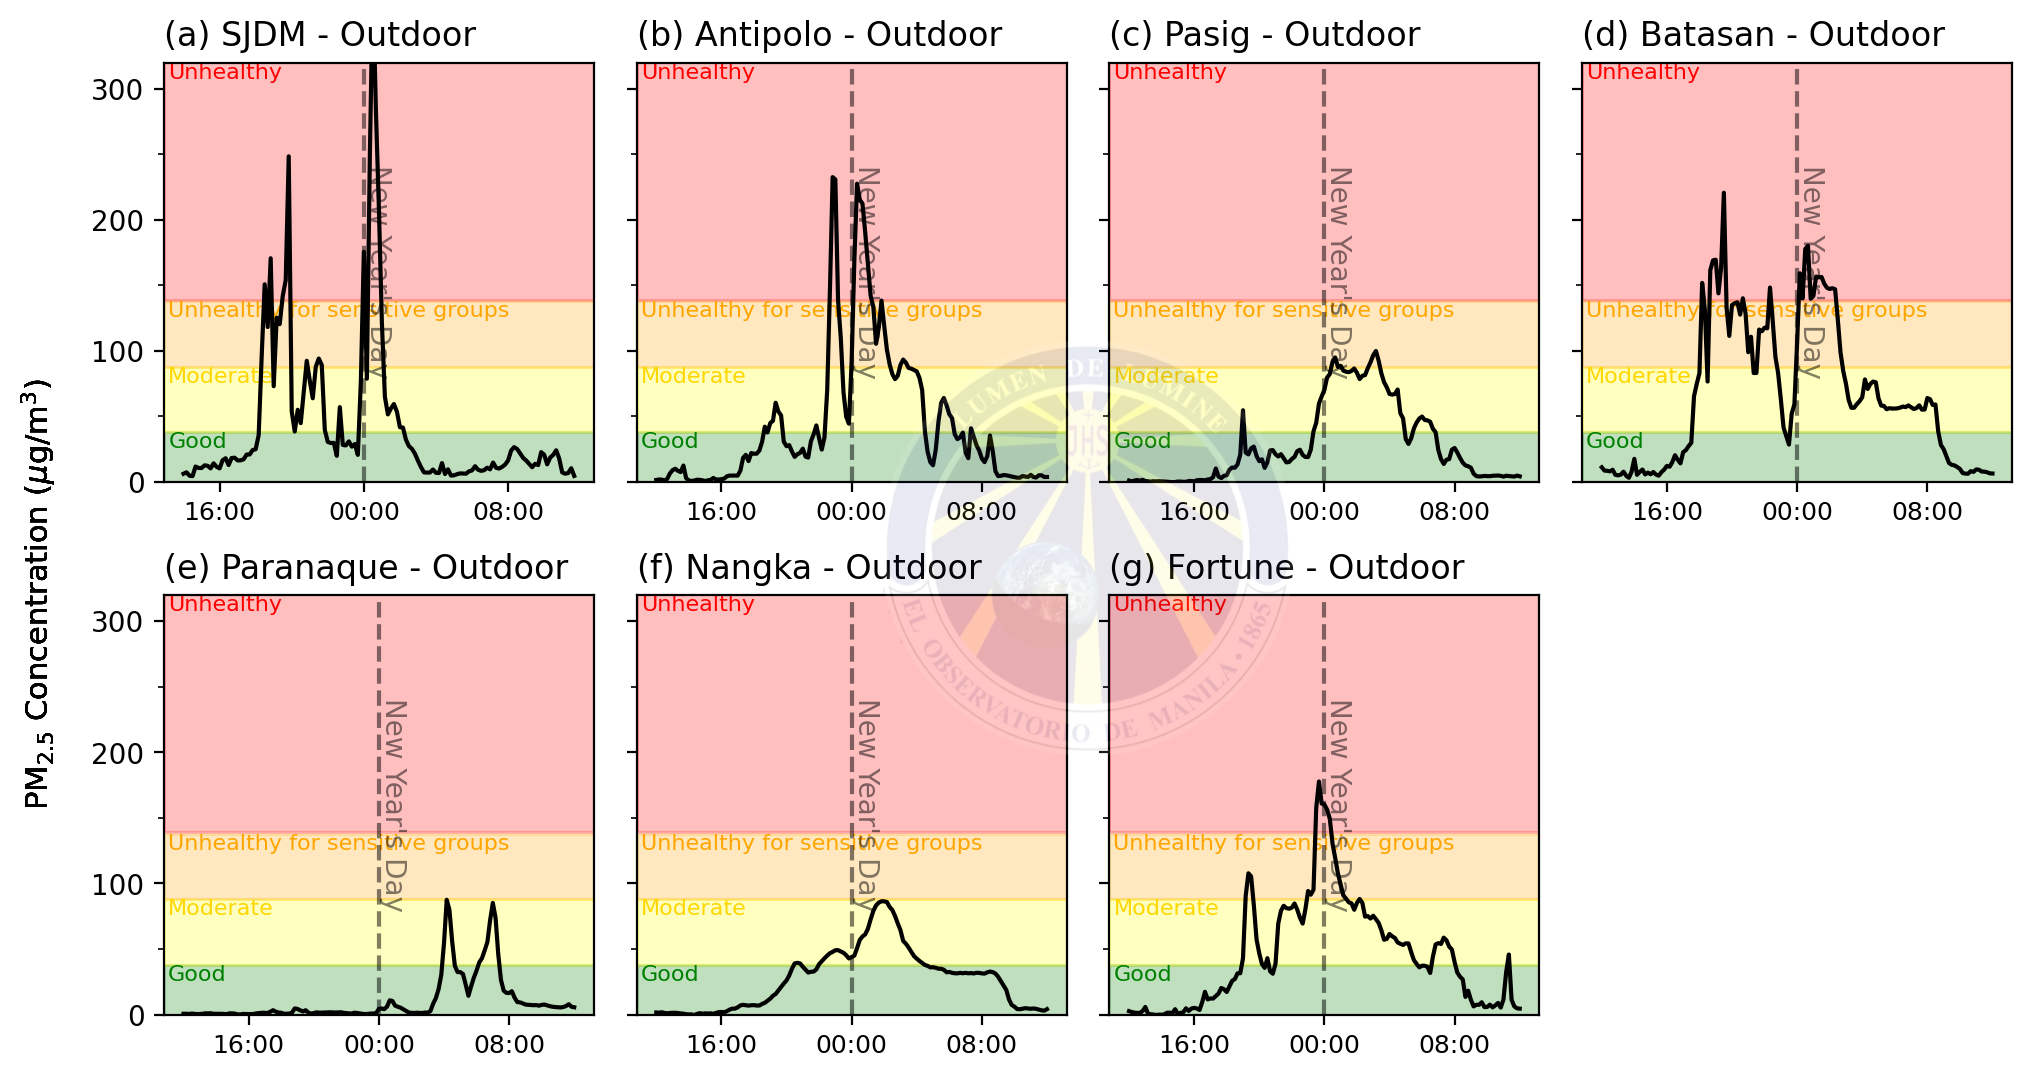
To complement the filter-based 24-hour sampling, PM2.5 measurements were also monitored at a finer temporal resolution (15 seconds). The AS-Lung portable samplers were deployed in six locations and operated from 12:00 p.m. of 31 December to 12:00 p.m. of 1 January. All AS-Lung samplers were positioned in a strategic outdoor spot (i.e balconies) to capture air pollution episodes. Figure 4 shows the real-time data averaged over 10-minute intervals.
Two out of six sites exhibited a spike in PM2.5 levels at similar hours. In San Jose del Monte (SJDM), Bulacan (Figure 4a), and Batasan Hills, Quezon City (Figure 4d), PM2.5 concentrations showed a sudden increase from 06:00 p.m. to 08:00 p.m, which may likely reflect usual activities and preparations for Media Noche. For instance, SJDM is a residential site where several households still use coal briquettes for cooking during large gatherings. PM2.5 concentrations in SJDM spiked from 35 µg/m3 to 248 µg/m3 while those in Batasan ranged from 65 µg/m3 to 221 µg/m3 during this period. Both sites reached “unhealthy” levels following US EPA – AQI breakpoints (Table 2) before midnight. “Unhealthy” AQI levels can increase aggravation of heart and lung diseases, especially in the elderly group of people. A gradual increase in PM2.5 concentrations was also observed before midnight in Antipolo (21 – 60 µg/m3) and Pasig (10 – 55 µg/m3) reaching “moderate” levels, while Fortune (17 – 108 µg/m3) reached levels “unhealthy for sensitive groups”.
Interestingly, the sudden surge in PM2.5 concentrations coincided with the midnight kick-off activities for most sites. Hence, the peak in concentration levels may be attributed to the lighting of firecrackers and setting off aerial firework displays, or even to some vehicles speeding and making noise at that time. Concentrations at the SJDMsite peaked at 381 µg/m3, classified as “very unhealthy” by AQI breakpoints. Concentrations in Batasan Hills (180 µg/m3) and Fortune (160 µg/m3) sites reached “unhealthy” AQI levels. The Antipolosite also reached “unhealthy” levels but with a unique two-peak pattern, the first peak at a maximum of 233 µg/m3 (10:50 p.m.) and a second peak reaching 228 µg/m3 at 12:20 a.m. The Pasigsite registered a much later increase in concentration up to 100 µg/m3 at 03:00 a.m. which corresponds to an AQI level considered “unhealthy for sensitive groups”. Similar to Pasig, the Nangka site recorded a late peak of 90 µg/m3 at around 02:14 a.m. Among all sites, the Parañaque site recorded the lowest concentration (19 – 88 µg/m3) due to few NYE-related activities around the neighborhood. Notably, concentrations in both Parañaque and Nangkasites were within “good” to “moderate” AQI levels.

Figure 4. Real-time PM2.5 concentrations (µg/m³) from 12:00 p.m. 31 December 2020 to 12:00 p.m. 1 January 2021 measured using AS-Lung portable PM2.5 samplers located in (a) San Jose del Monte, Bulacan; (b) Antipolo, Rizal; (c) Pasig City; (d) Batasan, Quezon City; (e) Parañaque City;(f) Nangka, Marikina City, (g) Fortune, Marikina City.
Since the Manila Observatory site has no available record of the AS-Lung sampler, real-time measurements of PM2.5 concentrations were collected by an E-BAM instrument. The instrument observed an increase in concentrations starting around 10:00 p.m., reaching AQI levels considered as “unhealthy for sensitive groups” by midnight, and peaking at about 300 µg/m3 at 03:00 a.m. (Figure 5). “Unhealthy” levels were sustained for almost four hours before decreasing and eventually returning to “good” levels past 08:00 a.m when there is possibly a larger control volume for pollutants to disperse due to a growing boundary layer during daytime (Hoyos et al., 2020). Compared to the data obtained for NYE 2021 where MO recorded “good” levels (less than 38 μg/m³) of PM2.5 concentrations, this year’s air quality proved to be worse with PM levels (as high as 300 µg/m3). This is also evident in the filter sample comparison in Figure 3, which shows darker deposits for 2022.

Figure 5. PM2.5 concentrations (µg/m³) from 12:00 p.m. 31 December 2021 to 12:00 p.m. 1 January 2022 from e-Beta Attenuation Monitor (e-BAM) located in Manila Observatory.
Low wind speeds observed from 09:00 p.m. 31 December to 06:00 a.m. 1 January for most weather stations in Metro Manila, may have possibly contributed to the stagnation of PM2.5 concentrations in each site.
Weather stations were also collocated with PM samplers at the Manila Observatory and Nangka to investigate the possible effects of winds on the observed NYE PM2.5 concentrations. The wind measurements at the Manila Observatory (Figure 6a) showed slightly stronger easterly winds (1.5 – 2.5 m/s) from 01:00 p.m. to 08:00 p.m. of 31 December and shifted to low northwesterly winds (less than 1 m/s) from 09:00 p.m. 31 December to 06:00 a.m 1 January. A reduction in wind speeds may have possibly contributed to the increasing PM2.5 concentrations collected by the E-BAM instrument due to the stagnation of pollutants over the area. It is important to note that low wind speeds (below 1 m/s) together with strong inversion layers due to radiative cooling at nighttime can enhance stagnation of pollutants such as from NYE firework activities (Hoyos et al., 2020). The late peak concentration at 03:00 a.m. also further suggests that the northwestern area (Quezon City) may be responsible for the “unhealthy” AQI levels observed over Manila Observatory.

Figure 6. Wind speed and direction (arrows point to the direction where the wind is blowing) at (a) Manila Observatory and (b) Nangka, Marikina, (c) Antipolo, (d) Pasig, (e) Mandaluyong, and (f) Parañaque, from December 31 (12 p.m.) to January (12 p.m.).
The Nangka weather station showed slightly stronger northerly to northeasterly winds as compared to Manila Observatory during the afternoon. Similarly, a shift to no winds or stagnant conditions was observed starting at 09:00 p.m. 31 December until 09:00 a.m 1 January which corresponds to an increase in PM2.5 concentrations. The increase in the 24-hour average PM2.5 concentrations (Figure 2c) also revealed that it reached “unhealthy” levels with significantly darker deposits (Figure 3) as compared to other sites, respectively.
Available weather stations near (but not collocated) the PM2.5 samplers may also give insights on the wind conditions over other locations in Metro Manila. Weather stations in Antipolo (SM Masinag) and Pasig (SM Pasig) showed easterly winds (less than 2 m/s) from 12:00 p.m. to 09:00 p.m. 31 December which then slowly shifted to weaker northeasterly winds (less than 1 m/s) from midnight to 06:00 a.m of 1 January. Winds over Mandaluyong (SM Megamall) were predominantly from the northwest (less than 1 m/s) in the same time period. Except for the Parañaque (SM BF Parañaque) weather station, wind speeds observed at all weather stations are relatively low and coming from the north to east during the firework activities, which may have contributed to the PM2.5 concentrations measured in these areas. In addition, there was no precipitation recorded, therefore no washout of particulate matter during this time.
In summary, this year’s New Year’s Eve celebration was associated with increased PM2.5 concentrations as compared to 2021 because of the less stringent COVID-19 protocols that were in effect. Despite the observed increase as compared to 2021, NYE 2022 PM2.5 concentrations were still lower relative to 2003-2016 levels which went beyond 400 µg/m3. The low wind speeds observed from 09:00 p.m. 31 December to 06:00 am 1 January for most weather stations in Metro Manila also highlight the role of winds in the stagnation of PM2.5 in each site. Even though these may be short-term exposures to higher concentrations, the public should remain vigilant as certain conditions have health implications, especially cardiovascular and respiratory symptoms among the sick, children, and elderly (Kim et al., 2015).
Appendix
Table 1. US EPA AQI for 24-hour PM2.5 concentrations.

Table 2. US EPA AQI for hourly PM2.5 concentrations.


Figure A1. Placements of MiniVol samplers in six sampling sites: a) Manila Observatory, b) Nangka, Marikina, c) Mambugan, Antipolo, d) Valle Verde, Pasig, e) BF Homes, Parañaque, and f) San Jose del Monte, Bulacan. (Photos courtesy of Paola Angela Bañaga).
References:
Ambade, B. (2018). Urban Climate The air pollution during the Diwali festival by the burning of fireworks in Jamshedpur city, India. Urban Climate, 26 (2018), 149–160. https://doi.org/10.1016/j.uclim.2018.08.009
Do, T.M., Wang, C.F., Hsieh, Y.K. &Hsieh, H.F. (2012). Metals Present in Ambient Air before and after a Firework Festival in Yanshui, Tainan, Taiwan. Aerosol Air Qual. Res. 12: 981-993. https://doi.org/10.4209/aaqr.2012.03.0069
Dockery, D. W., Pope III, C. A., Xu, X., Spengler, J. D., Ware, J. H., Fay, M. E., Ferris, B. G., & Speizer, F. E. (1993). An association between air pollution and mortality in six U.S. cities. In The New England Journal of Medicine, 329( 24), 1744–1759. https://doi.org/10.1097/00043764-199502000-00008
Greven, F. E., Vonk, J. M., Fischer, P., Duijm, F., Vink, N. M., & Brunekreef, B. (2019). Air pollution during New Year’s fireworks and daily mortality in the Netherlands. Scientific Reports, 9(1), 4–11. https://doi.org/10.1038/s41598-019-42080-6
Hime, N. J., Marks, G. B., & Cowie, C. T. (2018). A comparison of the health effects of ambient particulate matter air pollution from five emission sources. International Journal of Environmental Research and Public Health, 15(6), 1–24. https://doi.org/10.3390/ijerph15061206
Hoyos, C. D., Herrera-Mejía, L., Roldán-Henao, N., & Isaza, A. (2020). Effects of fireworks on particulate matter concentration in a narrow valley: the case of the Medell´ın metropolitan area. Environmental Monitoring and Assessment (2020) 192: 6. https://doi.org/10.1007/s10661-019-7838-9
Kim, K.H., Kabir, E., & Kabir, S., 2015. A review on the human health impact of airborne particulate matter. Environment International, Vol. 74, pp. 136-143. https://doi.org/10.1016/j.envint.2014.10.005
Lorenzo, G. R., Bañaga, P. A., Cambaliza, M. O., Cruz, M. T., AzadiAghdam, M., Arellano, A., Betito, G., Braun, R., Corral, A. F., Dadashazar, H., Edwards, E.-L., Eloranta, E., Holz, R., Leung, G., Ma, L., MacDonald, A. B., Reid, J. S., Simpas, J. B., Stahl, C., Visaga, S.M., & Sorooshian, A. (2021). Measurement report: Firework impacts on air quality in Metro Manila, Philippines, during the 2019 New Year revelry. Atmospheric Chemistry and Physics, 21(8), 6155–6173. https://doi.org/10.5194/acp-21-6155-2021
Lung, S. C. C., Chen, N., Hwang, J. S., Hu, S. C., Wang, W. C. V., Wen, T. Y. J., & Liu, C. H. (2020). Panel study using novel sensing devices to assess associations of PM2.5 with heart rate variability and exposure sources. Journal of Exposure Science and Environmental Epidemiology, 30(6), 937–948. https://doi.org/10.1038/s41370-020-0254-y
Pope III, C. A., Coleman, N., Pond, Z. A., & Burnett, R. T. (2020). Fine particulate air pollution and human mortality: 25+ years of cohort studies. Environmental Research, 183, 108924. https://doi.org/10.1016/j.envres.2019.108924
Ravindra, K., Singh, T., Vardhan, S., Shrivastava, A., Singh, S., Kumar, P., & Mor, S. (2022). COVID-19 pandemic: What can we learn for better air quality and human health? Journal of Infection and Public Health, 15(2), 187–198. https://doi.org/10.1016/j.jiph.2021.12.001
WHO. (2021). WHO global air quality guidelines: particulate matter (PM2.5 and PM10), ozone, nitrogen dioxide, sulfur dioxide, and carbon monoxide. Last Accessed on December 5, 2021, from https://www.who.int/publications/i/item/9789240034228
Zhang, X., Shen, H., Li, T., & Zhang, L. (2020). The effects of fireworks discharge on atmospheric pm2.5 concentration in the Chinese lunar new year. International Journal of Environmental Research and Public Health, 17(24), 1–19. https://doi.org/10.3390/ijerph17249333