by Gabrielle Leung, Genevieve Rose Lorenzo, Miguel Ricardo Hilario, Grace Betito, Paola Angela Bañaga, Imee Delos Reyes, Maria Obiminda Cambaliza, James Bernard Simpas, Nofel Lagrosas, Melliza Cruz, Khervin Cheng Chua, Fiona Samantha Ajoc, Robert Holz, Ed Eloranta, Ilya Razenkov, Fr. Jose Ramon Villarin, SJ, and Fr. Daniel McNamara, SJ
Introduction
Watching fireworks displays and lighting firecrackers are central components of the Filipino New Year’s Eve celebration. These explosions, albeit beautiful, are dangerous for their effects on human health. Every year, hundreds of Filipinos are rushed to the hospital due to accidents involving pyrotechnics. Besides the more visibly direct risks, fireworks and firecrackers also fill the air with smoke, which is a hazard both to visibility and respiration.
The smoke from fireworks and firecrackers poses a serious health risk due to considerable levels of criteria pollutants such as nitric oxide (NO), sulfur dioxide (SO2), and aerosols (Moreno et al., 2007). The aerosols released in such events are primarily emitted in the fine mode or PM2.5, which means particulate matter 2.5 micrometers or less in diameter—less than a tenth of the width of a single strand of hair. At this size, the aerosols are small enough that once they are inhaled, they can be absorbed by the lungs and bloodstream (Kim et al., 2015). Even short-term exposure to these pollutants, on the order of an hour, has been linked with asthma attacks and increased susceptibility to respiratory infections, as well as cardiac arrhythmias and heart attacks in people with prior heart conditions (Committee on the Medical Effects of Air Pollutants, 2006). Such problems are most serious to individuals who are members of vulnerable or sensitive groups, such as the elderly, children, and those with preexisting heart or lung diseases.
Long-Term PM2.5 Monitoring
Due to these alarming health risks, the Manila Observatory has been monitoring the air quality in several locations around Metro Manila. Sampling of PM2.5 has been going on during New Year’s celebrations every year since 2003. This year, particulate matter samplers (either filter-based or continuous optical samplers) were deployed in six locations, as indicated in Figure 1: Manila Observatory; Valle Verde 5, Pasig City; Antipolo City; Barangay Nangka, Marikina City; Barangay Barangka, Marikina City; and Las Piñas. Figure 1 also shows former sampling locations such as Greenhills, San Juan and Calumpit, Bulacan for reference.
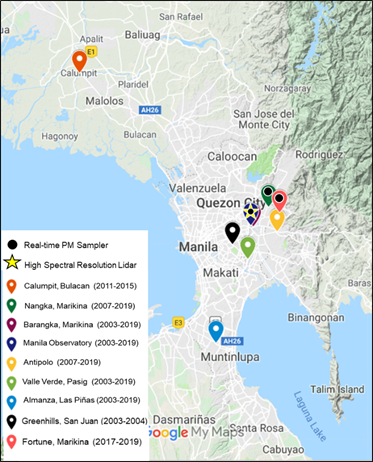
Figure 1. PM2.5 filter-based and continuous sampling measurement locations during the New Year (2003-2019). We note that Greenhills, San Juan and Calumpit, Bulacan are not sampling sites in recent years but are included here and in Figure 2 for reference. Fortune, Marikina City is a recent addition to Manila Observatory’s (MO) New Year sampling locations. In addition to the filter-based and continuous PM samplers, a High Spectral Resolution Lidar (HSRL) was also installed this year at the Manila Observatory.
Figure 2 shows PM2.5 concentrations collected from 2003 to 2019 in several sites using a portable MiniVol sampler loaded with Teflon filter starting from 12 n.n. of 31 December to 12 n.n. of 1 January. We note that for this year’s sampling, complete 24-hour sampler run was recorded only in three locations: Manila Observatory, Valle Verde 5 in Pasig City, and Antipolo City. Sampling was over a shorter period of time for Barangay Nangka, Marikina City and Barangay Barangka, Marikina City, lasting 11 hours and 19 hours respectively. For the Las Piñas location, the sampling was done for 25.5 hours.
These concentrations were plotted over the US EPA Air Quality Index (AQI) categories for 24-hour exposure, which are listed in Table 1. There is currently no Philippine PM2.5 AQI, which is why the US EPA AQI was used instead. The AQI serves as an indicator of air quality and provides the associated health risk for exposure to a given PM2.5 concentration. PM2.5 concentrations above 35.5μg/m3 (“unhealthy for sensitive groups”, colored in orange) pose significant risks for the aforementioned sensitive groups. Meanwhile, values above 250.5 μg/m3 (“hazardous”, colored in brown) are completely unsafe for people of all ages; in these events, everyone is recommended to stay indoors in filtered air away from the pollution source.
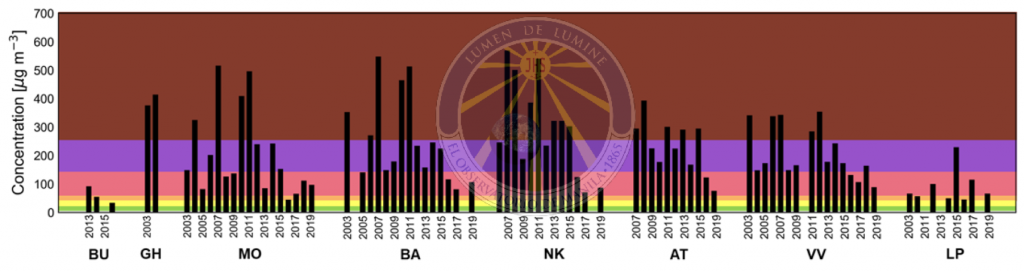
Figure 2. PM2.5 concentrations during New Year from 2003 to 2019. Samples were collected using a portable PM sampler on the following sites: Calumpit, Bulacan (BU); Greenhills, San Juan (GH); Manila Observatory (MO); Barangka, Marikina City (BA); Nangka, Marikina City (NK); Oro Vista Royale, Antipolo City (AT); Valle Verde 5, Pasig City (VV), and Almanza, Las Piñas (LP).
For most of the sites, samples collected from 2003 until 2019 reach levels that range from “unhealthy” to “hazardous” to human health. In more recent years, the 24-hour PM2.5 concentration is lower compared to concentrations recorded from 2003 to 2011. The values measured for this year (New Year’s Eve 2018/2019) were lower compared to the previous year for four out of the six sampling locations. On the other hand, PM2.5 concentrations increased slightly from last year to this year for Barangka, Marikina City and Nangka, Marikina City, though they were still relatively lower than all other years for those sites.

Regardless of these trends, all the PM2.5 measurements for this year are at “unhealthy” levels. This means that for the 24-hour period around the New Year’s Eve celebrations, even healthy people are at risk of respiratory effects, and people in vulnerable groups are at an increased risk of serious health effects.
We also note that although the sampler only ran for 19 hours in Barangka, Marikina City, this location still recorded the highest PM2.5 concentration (105 µg/m³). This elevated level of fine particulate matter may be driven by a combination of topography, meteorology, and pollutant emissions (Mwaniki et al., 2014). Because Marikina City is a valley, air pollution tends to be trapped during stable atmospheric conditions within the nocturnal boundary layer. This leads to the particulate matter concentrations building up to unhealthy levels, especially when pollutant emissions are significantly increased as they are during the New Year’s Eve celebrations.
Real-Time PM2.5 Measurements
Apart from the 24-hour filters, real-time measurements of PM2.5 were also conducted using two Location Aware Sensing System (LASS) sensors and an AS-Lung personal exposure sampler. The locations are also indicated in Figure 1. The personal exposure sampler collected data from the Manila Observatory on an outdoor balcony; the two LASS sensors collected data from an outdoor location at Barangay Fortune, Marikina City, and Barangay Nangka, Marikina City. However, it should be noted that the sensor deployed at Barangay Nangka stopped collecting data at 11:00 p.m. of 31 December, so the data from that site is incomplete.
The real-time measurements are of a much finer temporal resolution compared to the 24-hour filters; particulate matter concentrations are measured every 15 seconds for the personal exposure sampler, and every second for the LASS sensors. This monitoring is important, especially for members of vulnerable groups, because it allows individuals to manage their exposure to acute bursts of pollution. We note that the Philippines has no AQI for hourly PM2.5 but the US EPA AQI has separate standards for short-term exposure to PM2.5; the plots in this section are colored accordingly, and the standards are listed in Table 2. PM2.5 concentrations above 89.0 μg/m3 are unhealthy for sensitive groups, while PM2.5 concentrations above 527.0 μg/m3 are hazardous for all people.

Figure 3a shows the real-time PM2.5 concentrations at the three sites in question. At the Marikina sites, the concentration slowly increased from 4:00 p.m. to 11:00 p.m., followed by a sharper increase towards peak PM2.5 concentrations. The sampler at Manila Observatory began measurement later than the first two samplers, but it reflects a similar rapid increase in PM2.5 concentrations between 11:00 p.m. and 1:00 a.m. with peak values at 420 μg/m3 observed at 2 a.m. on 1 January 2019. The air quality returned to typical conditions of below 50 μg/m3 (comparable to the average levels for normal days of the year) by 8:00 a.m. on New Year’s Day.
Figure 3b shows real-time PM2.5/PM10 ratios over the sampling period. Ratios are consistently over 0.7 throughout the sampling period, indicating that fine PM, which can bypass the natural filters of the body and lead to respiratory problems, has a dominant contribution to total PM. At Manila Observatory, the sampler showed the highest PM2.5/PM10 ratio at around 0.93 from 10 p.m. until 6 a.m. and an average of 0.91 which indicates that nearly all the PM in the air during the sampling period could penetrate the lungs.
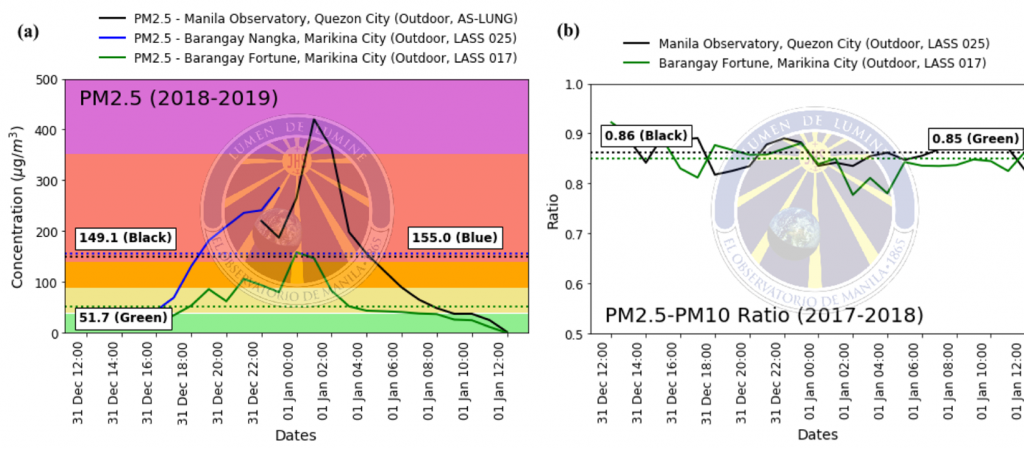
Figure 3. (a) Real-time PM2.5 concentrations for the indicated sampling locations from 31 December, 2018 (12 PM) to 1 January, 2019 (12 PM), plotted over colors corresponding to the US EPA AQI for hourly PM2.5 (Table 2), and (b) PM2.5/PM10 ratios during the sampling period. The dashed lines indicate an average over the sampling period.
Data for the outdoor site at Nangka is incomplete, but even before reaching the height of the New Year festivities, it has PM2.5 values in the very unhealthy to hazardous range, owing to both the lowered boundary layer at nighttime and the increased level of particulate emissions. After 12:00 m.n., when particulate emissions are at a maximum, these concentrations are expected to further rise. At those levels of pollution, everyone (even healthy people who are not members of the at-risk groups) may experience serious health effects.
We note that in recent years, we also deployed indoors a continuous PM2.5 LASS sampler in Manila Observatory, Quezon City. Our previous results showed that even inside, in environments where the ambient outdoor air is able to penetrate indoors (through open windows and through the building itself), air pollution from the New Year’s Eve event is bad enough to be of concern. The extent that outdoor particles are able to penetrate indoors is dependent on a variety of factors, including the building shell, particle penetration efficiency, and particle deposition rate (California Air Resource Board, 2004). To avoid the effects of the pollution event, it is not sufficient to merely go indoors, since indoor air quality is already dangerous to health; instead, it is advisable to stay indoors in a room where the air is filtered.
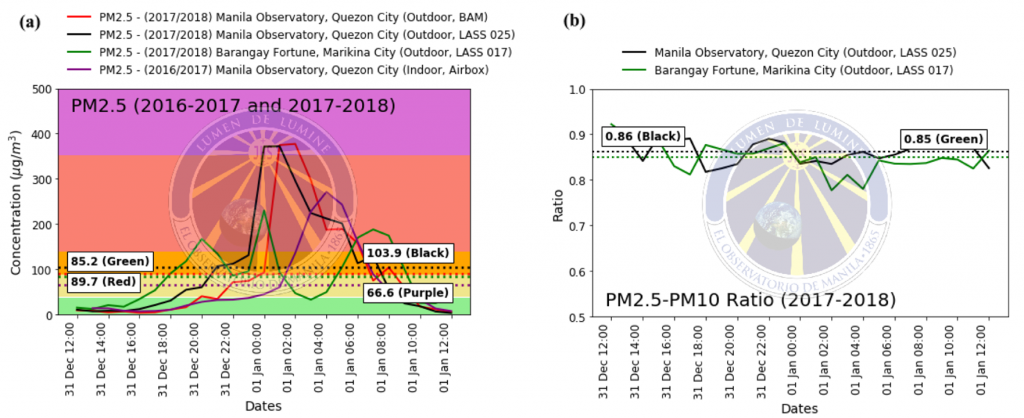
Figure 4. (a) Real-time PM2.5 concentrations for Manila Observatory, Quezon City and Barangay Fortune, Marikina City from 31 December 2017 (12 PM) to 1 January 2018 (12 PM) by various samplers and from 31 December 2016 (12 PM) to 1 January 2017 (12 PM) by the Edimax Airbox sampler, plotted over colors corresponding to the US EPA AQI for hourly PM2.5 (Table 2). (b) PM2.5/PM10 ratios during the sampling period in 2017 to 2018 for Manila Observatory, Quezon City, and Barangay Fortune, Marikina. The dashed lines indicate an average over the sampling period.
Compared to previous years, the PM2.5 concentration in Barangay Fortune, Marikina City was considerably lower (the 24-hour average was 51.7 μg/m3 in 2018/2019 versus 85.2 μg/m3 in 2017/2018, as shown in Fig. 3a and Fig. 4a, respectively). The average PM2.5/PM10 ratio also decreased slightly from 0.85 (Fig. 4b) to 0.75 (Fig. 3b) but hovers between 0.7 and 0.9 during New Year’s Eve. Even with decreased PM2.5 levels in Barangay Fortune, Marikina City, the peak concentration reached 158.2 μg/m3 (Fig. 3a), which is within the “unhealthy” range based on EPA’s AQI for hourly PM2.5 (Table 2). This peak concentration value persisted for two hours from 12 m.n. to 2 a.m. before slowly tapering off to typical values. It is possible that this decrease in particulate matter is due to a decline in the use of fireworks and firecrackers in conjunction with stricter regulations on pyrotechnics and the ban on certain firecrackers as part of Executive Order 28 s. 2017. A delayed peak is noted for the indoor sampler in 2016/2017 (Fig. 4a; plotted in purple) which suggests that indoor environments receive a delayed effect from New Year’s emissions as compared to outdoor areas but still reach “Unhealthy” levels according to the US EPA AQI (Table 2).
That being said, it is likely that the decreased PM2.5 concentration in some locations is also due to meteorological factors. As shown in Fig. 5a, brief spikes in precipitation occur at around 10 p.m. on 31 December and 4 a.m. on 1 January. Precipitation is known to reduce pollution concentrations through the removal of particulate matter from the air; consequently, peak precipitation times coincide with non-peak PM2.5 concentration periods (Fig. 3a, 5a). Unfortunately, the general absence of precipitation for the most of the night and early morning allows for PM2.5 from New Year’s festivities to remain in the air as seen in the large spike in PM2.5 from 12 m.d. until 2 a.m., reaching “very unhealthy” levels in MO and “unhealthy” levels in Barangay Fortune, Marikina City, measured against the US AQI (Fig. 3a).
On the other hand, the transport mechanism of PM2.5 via wind is a cause for concern for increased pollutant levels. Fig. 5b shows an increase in wind speed from the northeast direction between 12 m.n. until 2 a.m, during which we observe the peak PM2.5 concentrations in both MO and Barangay Fortune sites (Fig. 3a), followed by a period of nearly no wind (wind speed showed near-zero values) between 4 a.m. until 8 a.m., during which a drop in PM2.5 concentration is observed (Fig. 3a). These patterns suggest that an area northeast of MO was responsible for the dangerous levels of PM2.5 sampled. Considering the tendency of fine particles to remain in the air for longer periods of time (Cohen et al., 2010), domestic transport of such pollutants poses a health risk, not only for the emission site but also for nearby downwind areas.
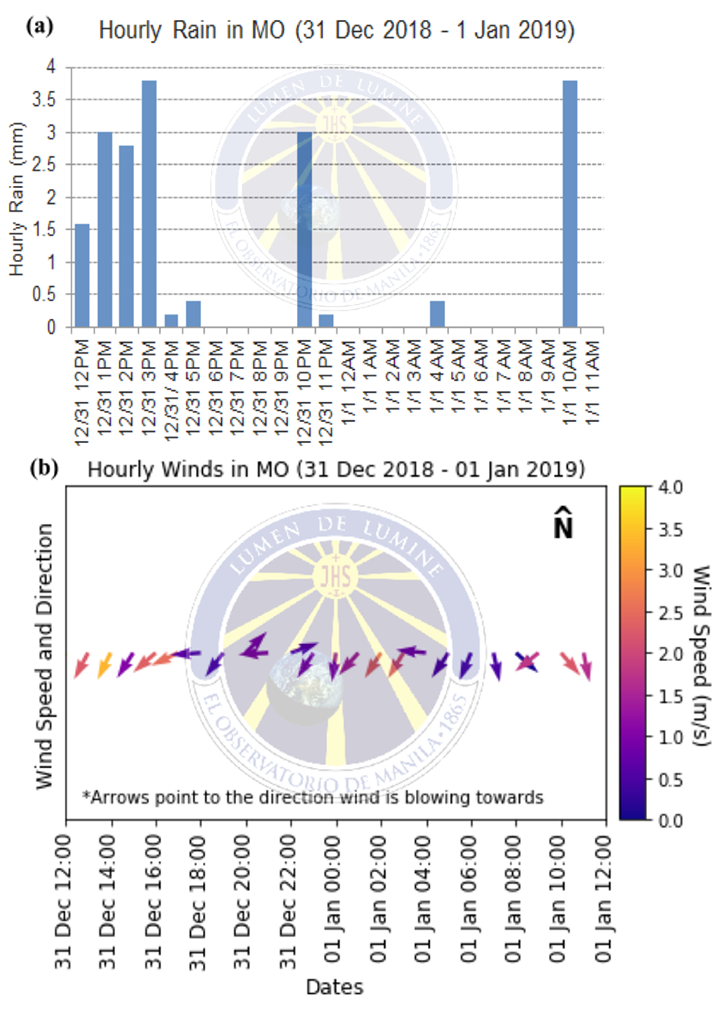
Figure 5. (a) Hourly rainfall and (b) wind speed and direction (arrows point to the direction wind is blowing towards) at Manila Observatory from December 31 (12nn) to January 1 (12nn).
High Spectral Resolution Lidar
In addition to data from in-situ PM2.5 samplers, a High Spectral Resolution Lidar (HSRL) was also collecting vertical profiles of aerosol backscatter data at the Manila Observatory site during the New Year’s festivities (Fig. 6). The HSRL is a light detection and ranging instrument that makes use of laser light in the visible and infrared regime (green light at 532 nm wavelength and infrared light at 1064 nm) to determine the aerosol size and composition in the ambient atmosphere within and above the boundary layer. The HSRL from the University of Wisconsin was installed at the Manila Observatory in December 2018 to obtain a year-long baseline ground-based remote sensing data on aerosol size and composition in preparation for CAMP2Ex, the NASA Airborne field campaign, in July 2019. Figure 6 shows the HSRL’s green laser light visible in the night sky during the New Year 2019 revelries.
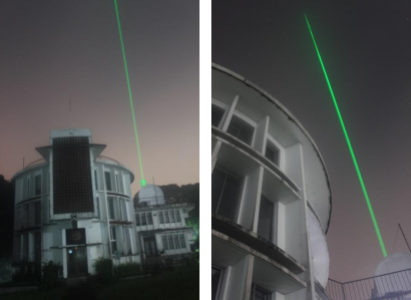
Figure 6. Green laser light from the University of Wisconsin’s High Spectral Resolution Lidar (HSRL) deployed at the Manila Observatory. The HSRL characterizes the vertical distribution of aerosol size and composition within and above the boundary layer of Metro Manila. Image courtesy of Ms. Genie Lorenzo.
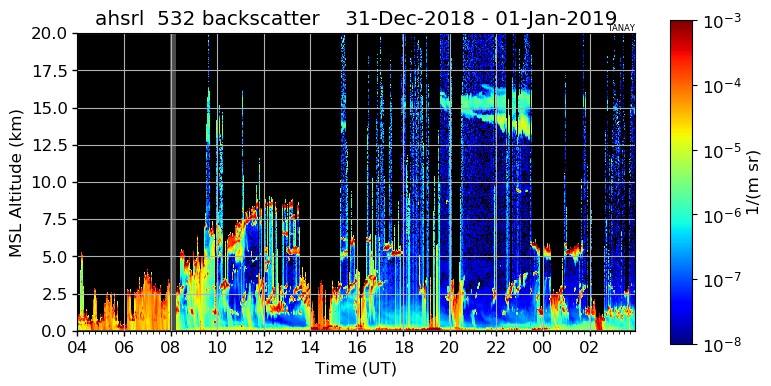
Figure 7. Aerosol backscatter from the High Spectral Resolution Layer (HSRL) at Manila Observatory from 31 December (12 n.n. local time, 04 UT) to January 1 (12 n.n. local time, 04 UT). Timestamp is in Universal Time (UT) and local time is UT + 8 hours.
From Figure 7, the precipitation between 04 and 08 UT (also seen in Figure 5b, 12n.n to 4 p.m. local time, Dec 31) can be seen with the attenuation of the lidar at about 2 km during this period. The precipitation lightens afterwards and mid-level water cloud is present between 5 – 14 UT. Attenuation due to precipitation occurs similarly at 14-15, 20, and 02 (next day) UT. Very high cirrus clouds are detected starting around 20 UT centered at 15 km.
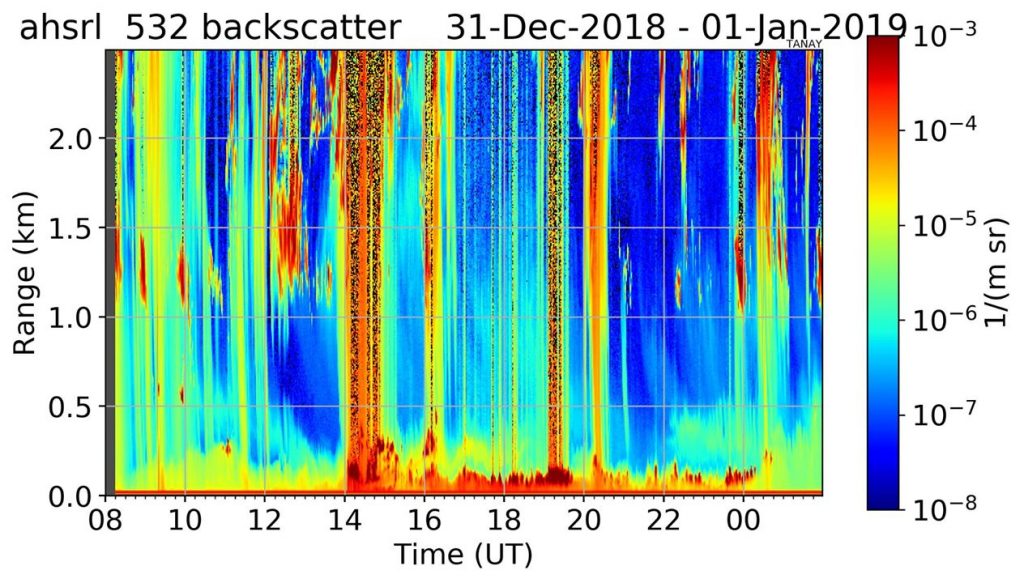
Figure 8. Aerosol backscatter from Figure 7 but zoomed in to highlight the boundary layer (lowest 2.5 km of the atmosphere) Timestamp is in Universal Time (UT) and local time is UT + 8 hours (4 p.m. 31 December to 9 a.m. 1 January).
Zooming in for a higher-resolution look as shown in Figure 8, we note the ~200 m layer aerosol enhancement from around 14 to 00 UT (10 p.m. 31 December to 8 a.m. 1 January local time) which is consistent with elevated PM2.5 (at MO) during this period (Figure 3a).
Visibility
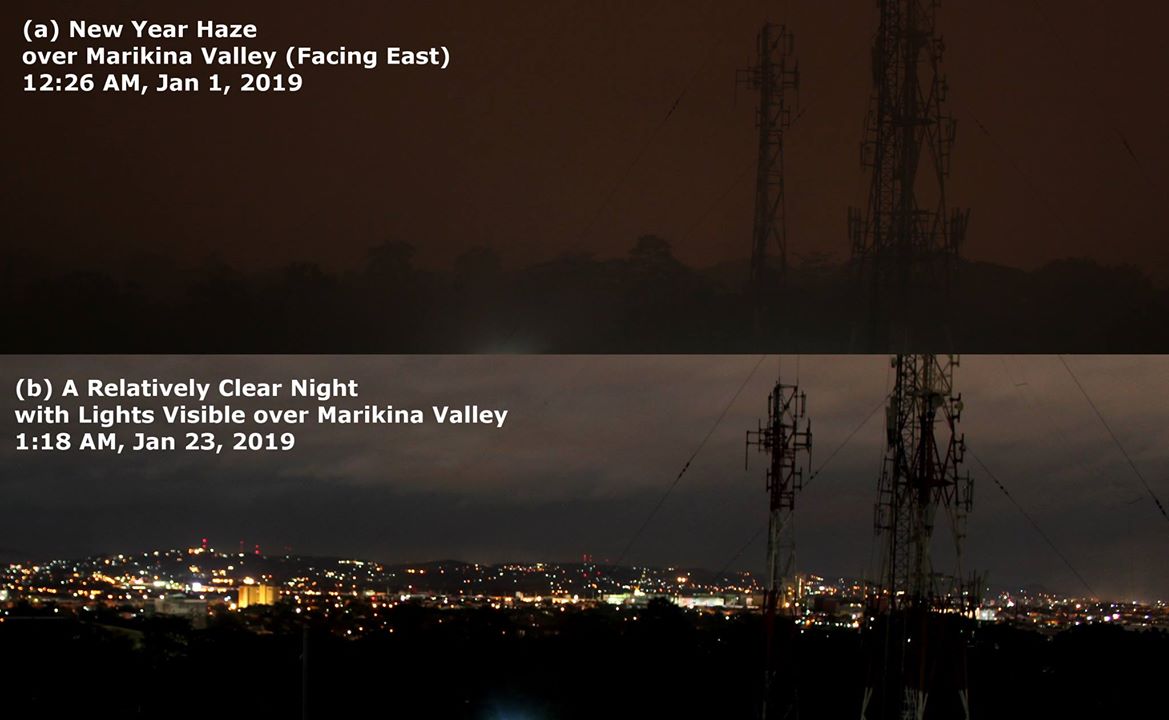
The aerosol enhancement observed during the 2019 New Year’s eve celebrations in Metro Manila caused visibility reduction all around. Marikina Valley was covered in the smoke from fireworks and firecrackers. And from Manila Observatory, at midnight, the lights (Figure 9b) from the houses and buildings in Marikina Valley could not be seen (Figure 9a).
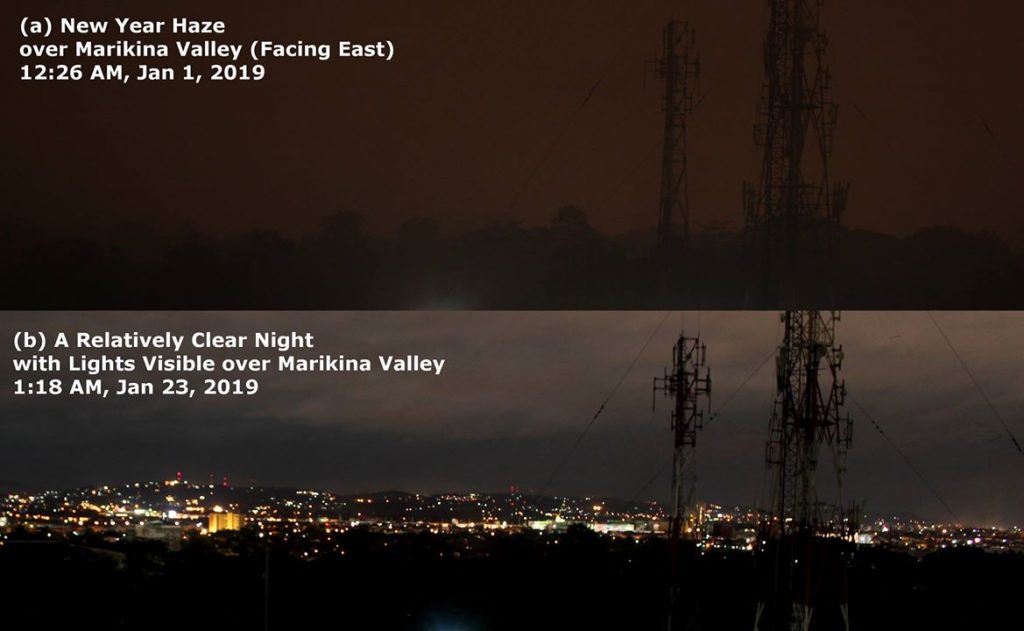
Figure 9. The visibility over Marikina Valley is reduced during the New Year. Lights from houses and buildings in the Marikina Valley could not be seen from the Manila Observatory during the New Year 2019 (a) because of the smoke from the fireworks and firecrackers. On a night with better air quality, the valley is filled with lights (b).
This latest report from our series of New Year’s studies is unique in that we have been able to employ ground-based in-situ as well as remote-sensing instruments. This was made possible by collaborations with international colleagues from University of Wisconsin, US Naval Research Laboratory, and the US National Aeronautics and Space Agency. These measurements have allowed us to characterize the New Year’s Eve air quality like never before. We remain committed to this yearly endeavor to characterize the most polluted day of the year.
References
California Air Resource Board Research Division, 2004. Detailed Characterization of Indoor and Personal Particulate Matter Concentrations- Final Report. Contract No. 00-302.
Cardiovascular Disease and Air Pollution, 2006. A report by the Committee on the Medical Effects of Air Pollutants. Retrieved from https://www.gov.uk/government/publications/comeap-cardiovascular-disease-and-air-pollution.
Cohen, D. D., Crawford, J., Stelcer, E., & Bac, V. T. (2010). Long range transport of fine particle windblown soils and coal fired power station emissions into Hanoi between 2001 to 2008. Atmospheric Environment, 44(31), 3761–3769. https://doi.org/10.1016/j.atmosenv.2010.06.047.
Executive Order. No. 28, 2017.
Kim, K.H., Kabir, E., and Kabir, S., 2015. A review on the human health impact of airborne particulate matter. Environment International, Vol. 74, pp. 136-143.
Moreno, T., Querol, X., Alastuey, A., Minguillon, M.C., Pey, J., Rodriguez, S., Miro, J.V., Felis, C., and Gibbons, W., 2007. Recreational atmospheric pollution episodes: Inhalable metalliferous particles from firework displays. Atmospheric Environment, Vol 41, Issue 5, pp.913-922.
U.S. Environmental Protection Agency (USEPA), 2004. The Particle Pollution Report. Current Understanding of Air Quality and Emissions through 2003.
U.S. Environmental Protection Agency (USEPA) Air Quality Index. https://www3.epa.gov/airnow/aqi_brochure_02_14.pdf, accessed 19 Jan 2019.
Mwaniki,G.R., Rosenkrance, C., Wallace, W., Jobson, Tom., Erickson, M., Lamb, Brian., Hardy, Rick., Zalakeviciute, R., and VanReken, T. (2014) Factors contributing to elevated concentrations of PM2.5 during wintertime near Boise, Idaho. Atmospheric Pollution Research 5: 96-103.