Space-Based Information for Understanding Atmospheric Hazards in Disaster Risk
by Gemma Teresa T. Narisma, PhD
[Delivered at the DOST Space Forum, “The Philippines: Crossing the Atmospheric Borders,” last 20 July 2018 during the DOST National Science and Technology Week (NSTW) at the World Trade Center. Dr. Gemma Teresa T. Narisma is the Executive Director of Manila Observatory and Associate Professor of the Department of Physics of Ateneo de Manila University. Photo by James Bernard Simpas. Transcribed and edited by Quirino Sugon Jr.]
I was actually supposed to talk this morning. I apologize for moving the talk this afternoon. I had to wade through raging waters and cut across traffic. Then the car broke down.
I am here to share our work and to talk about “Space-based information for understanding atmospheric hazards and disasters.” I would like to acknowledge my colleagues from the Manila Observatory: Dr. Vicente, Dr. Sugon, and Dr. Simpas who are also here and are part of this work.
So just a quick background on what the Manila Observatory is. It is a 150 year old institution. It is primarily established by a Jesuit priest Padre Faura, SJ to study the typhoons that occur in the Far East. He later expanded his scientific pursuits to include Seismology and Astronomy.
Now, in our current research work, we have research laboratories in Air Quality Dynamics / Instrumentation Technology Development; we have Geomatics for Environment and Development which really uses a a lot of these space-based information; Regional Climate Systems where I belong to (I’m a Climate Scientist); our Solid Earth and Upper Atmosphere Dynamics. And these are the different research areas that we are involved in.
In our work at the Manila Observatory, we do get involved in a lot of utilization of space-based information, because it gives us a holistic perspective—completes the picture when a particular extreme event happens.
For example, this is in 2015 when Typhoon Bopha (Typhoon Pablo) hit. We wanted to have a general idea of where the typhoon is and what are the areas that are going to be affected. These are the other indicators of what might happen in terms of disasters, e.g. poverty incidence and population density. We use JTWC tracker of the Joint Typhoon Warning Center. We use low elevation SRTM—if I am correct, Celine—and also the affected areas that we term as low elevation coastal zones.
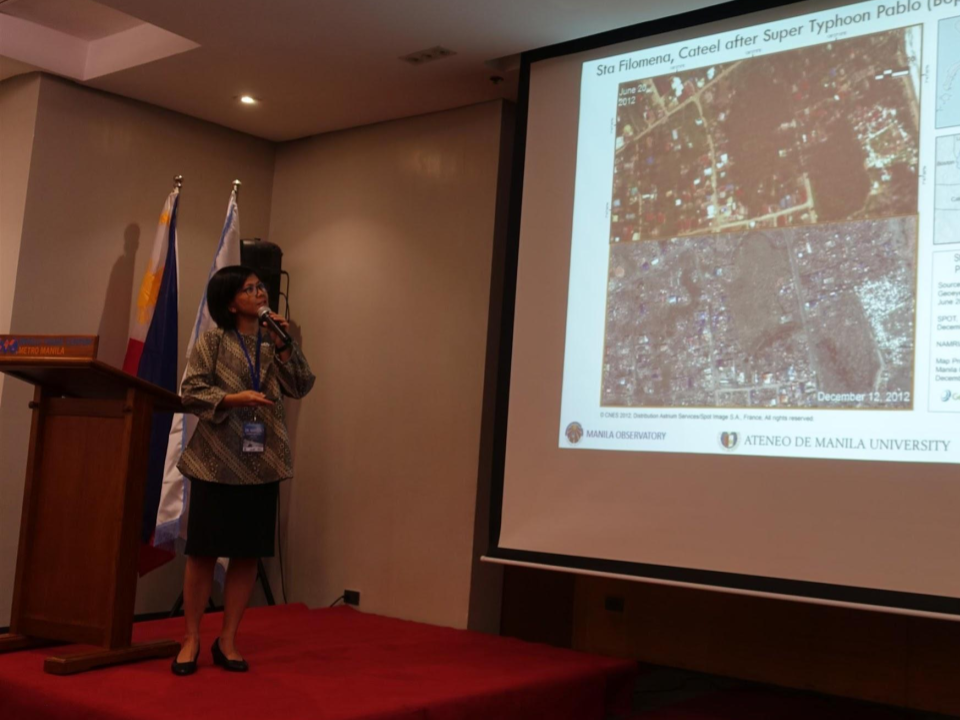
After such extreme events in recent years, unfortunately, we all know I think—that is why we’re here. The Philippines has very strong tropical cyclones or extreme weather events—not quite, as I would say, milder than the extreme events we’ve had before. So this is an example of a tropical cyclone, a super typhoon that happened a year before super Typhoon Haiyan. This is in the southern part of the Philippines here on the eastern part of Mindanao. This is before Typhoon Bopha hit the area, and this is after. This is through Sentinel Asia—if I am correct Celine—that activates a special permission, I guess, to get all these images to help us assess potential damage.
This is another work by our Geomatics and Environment for Development on an enhanced southwest monsoon system. We call it habagat—Habagat 2013. Using TerraSAR-X, our GED laboratory was able to identify the areas that were flooded. It took a while for the flooding to subside in these areas here. Zooming in, let us say, in the area that is close to where we are here in Pasay City. These are the areas. And you can see flood footprints affected particular parts. These have been very useful for us to assess just how bad tropical typhoons were and extreme events can be and how they can affect people.
However, aside from just thinking about in terms of assessment and damage, and looking at what is what happening, etc., it was important for us to note that space-based information and space-based technology have been more and more looked at in terms of disaster risk reduction and building resilience. This is actually a piece of news from UNISDR way back in 2013. It was interesting to me that before we were talking about it earlier. We talked about outer space. During my time when I was young, outer space is like E.T.: outer space is out there. But now outer space really is something where you can actually look into to build resilience and reduce disaster risk. It is a new way of thinking. And as we all know, we are now really thinking of incorporating space technology in the post-2015 disaster risk reduction framework.
In our case, when we talk about disaster risk, we usually look at these three elements. This is the framework that is also adapted by the Intergovernmental Panel on Climate Change. It is a risk framework that tries to look at how these three critical factors combine together to result in increasing risks and disasters, let’s say, i.e. hazard, exposure, and vulnerability. My work in particular really focuses on hazard in terms of climate change, extreme weather events, and how things might change in the future. We look at also exposure and how this might feed into hazard and I will show you that later on. And we assess vulnerability by looking at locations wherein most of the vulnerable people might be located.
I will just look at this at the start. I am looking at hazard. We use a lot of rainfall assessment from satellite-based rainfall estimates. This is from TRMM. Now we have GPM. This is tropical storm Washi which happened in 2011. It hit again Mindanao and brought a lot of rain. It was a good indicator of what was coming. After that we just plotted and tried to visualize how it went forward into Mindanao. This is the rainfall. This is one of the badly hit areas. This is where Cagayan de Oro is located. You can see the big spot of rainfall happening in this area.
Aside from that though, we do a lot of regional climate modelling. It is way for us to see what can probably or potentially or plausibly happen in the future. But regional climate models are precisely that–just models. Before we can say the model is good, we have to validate it. As such, we do need good data for it to be validated. There are different variables that we can look at, e.g. winds, etc. Rainfall is a critical one. So in this case, one of the things that we are trying to see is how we can use satellite-based rainfall to use for our model validation and whether it will also give us insight on whether we are able to get the processes right.
This is again TRMM here. And these are the different gridded data sets that are available. This is APHRODITE from Japan. This is from the UK, the Climate Research Unit. This is GPCC. And this is TRMM. TRMM is valuable information in a sense that it gives us information not just on land like the other gridded data sets show, but also gives us information over ocean. And that is important, because a lot of the processes that do go into the land afterwards are developed over oceans. It is important for us to see what is also happening in the oceans.
We try to look at TRMM. This is from 1998 to 2007. This is June, July, August. And this is ONDJF (October, November, December, January, February). We look at Aphrodite. This is a gridded observation data that is based on ground observation stations. And this is the satellite-based rainfall. We see that it does capture the southwest monsoon rainfall in JJAS (June, July August, September). And we also see here that it does capture the rainfall that is also associated with the northeast monsoon. It is good for us to use in our research work and we try to look at climatology when we try to look at how models are also able to assess that climatology.
Going back to this now and having looked at hazard, one more thing though: we note that although we can do the TRMM and look at how rainfall extremes were happening, etc., a critical area that is important to assess in looking at risk management and hazard management is exposure. Exposure is two-pronged, because if we have high exposure then your risk for disaster increases. But at the same time, that exposure is a “complicating exposure” that is brought about by the complexity of urban development and that exposure actually feeds into a secondary hazard in a sense.
If you would look at Metro Manila, for example, (this is from Landsat, an analysis again by GED) this is the percentage of forests or green cover, let us say, and this is built up area. If we go from 1972 to the latter years, we will see how Metro Manila has changed from 1972, 1979, 1989, 1999, and 2009. That is how much Metro Manila has expanded. It has been worst now. And so the flooding that I went through earlier was not just because of the heavy rain, but probably because of this built up area and development also—it gets very complex. Again, this is a satellite-based information. You couple that with how Metro Manila is. These are the major river systems. And you have here the low elevation coastal zones; these are 5 meters and below. You have here the mountains; these are low elevation; and the waters coming down here. Then you know how we are set up: we get a bigger picture on why urban Metro Manila is a megacity that is high risk to disasters. That is why we are no. 3 when it comes to being prone to disaster in the World Risk Report.
If you look at where the informal settlements are located—we detected these using satellite image analysis—these are the areas of informal settlements. The orange ones are big settlements. And we see that a lot of these informal settlements are really located in these flood prone areas. We detect where vulnerability is. Higher vulnerability implies again higher risk to disasters. The last thing that I like to point out is that you have the rainfall hazard. You have exposure that also introduces a secondary hazard.
There is a hidden hazard or a quiet hazard that sometimes we do not include in the picture and that is really air pollution. We see it when we travel in Metro Manila. Climate change and air pollution are really intertwined together.
This is a figure of PM 2.5 concentration in Metro manila in 2010 which the Air Quality group did. This is modeled. This is 5 to 10 times the guideline values. This is not good. The good ones are these colors. These colors are not good. And again, if you try to look at that pollution and put that side by side with human exposure and put that side by side again with flood prone areas and you get to detect hotspots where you should concentrate when you want to reduce risk to disasters, because there is both exposure and human vulnerability. So the thing with air pollution and climate change is that they are separate hazards, but at the same time they intersect or contend or interact with each other. Climate change can affect air quality and air quality can affect climate change.
We are now beginning to look at emissions. For example, this is NOx. Particularly, this one is NO2. We look at NOx and we look at the emissions and modeled these using a mesoscale model. This is the tropospheric vertical column density, which let’s us see where these high concentrations of pollution are. Now we use satellite-based information and try to see whether our model is able to get more or less the spatial pattern of where these high concentrations of NO2 are located. And we are able to validate, because there is no other picture, there is no gridded data for NOx, etc. We are able to now see that indeed the model is able to get the distribution correctly.
More and more, let me think of that—air pollution and then climate—it is really asking ourselves: are the models capturing that interaction right?
Aerosols affect cloud formation. There is a campaign, which is called the “Clouds, Aerosols, Monsoons Processes Philippines Experiment” Campaign (CAMP2Ex). It is going to be with NASA—you might have met Hal Maring and Jeffrey Reid of NRL—and the Manila Observatory. The goal really is to understand these processes and how these will affect rainfall, how they interact, etc. It is going to happen in 2019. The overall research focus simply is looking at aerosol particles and how they could influence precipitation in tropical environments. There will be an airplane; it is an airborne campaign. There will be a lot of satellite measurements. We’re also going to do a lot of modelling. This really is an intersection on how to understand the physical system given these three methods of looking at the different variables.
This is how air pollution is transported from Indonesia and this where most of our local conditions are. So in this sense, maybe these are all different pieces—air pollution, how urbanization happens, you have your clouds, etc.—but these are really part of our whole climate system. I think it is very important to sort of zoom out at how everything pieces together. In zooming out, understanding also the opportunity for space-based information to somehow lead us to look at this and say, “This is how we should attack it.”
I will just leave with this quote from Elena Molin Valdes of the UNISDR:
“The question now is how will you take space-based technologies and the information they capture to the wider issue of disaster risk reduction and long-term sustainable development.”
Thank you.