by Melliza Cruz, Genevieve Lorenzo, Paola Bañaga, Grethyl Catipay, Grace Betito, Erica Banares, Maria Obiminda Cambaliza, Nofel Lagrosas, James Simpas, Jose Ramon Villarin, and Daniel McNamara
Lighting fireworks and firecrackers have long been a part of the Filipino New Year’s tradition. However, amid the beautiful displays and loud noises, this exuberant practice results in direct injuries, decreased visibility, and air pollution episodes that are detrimental to human health. Studies show that burning fireworks emits considerable amounts of nitric oxide (NO), sulfur dioxide (SO2), and aerosols (Moreno et al., 2007). The majority of firework-related aerosols are in the fine mode so they are small enough to penetrate deep into the lungs and even the bloodstream (Kim et al., 2015). Even though these pollution episodes are transient, short-term exposures to fine particles can cause asthma attacks, acute bronchitis, and may increase susceptibility to respiratory infections. Heart attacks and arrhythmias have also been associated to short-term particle exposure of people with existing heart disease (US EPA, 2003).
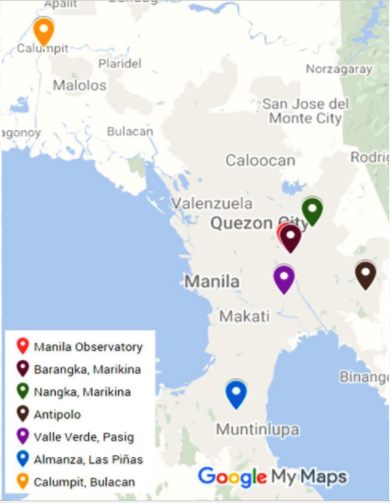
Figure 1. PM2.5 measurement locations during the New Year (2003-2017)
The Unites States Environmental Protection Agency (US EPA) has created an Air Quality Index (AQI) for PM2.5 and other criteria pollutants. Each category represents a range of concentrations and level of health concern. PM2.5 is a mixture of solid particles and liquid droplets with sizes less than 2.5 micrometers. It is an important criteria pollutant as it may cause respiratory and cardiovascular diseases upon inhalation (COMEAP, 2006). When PM2.5 concentrations reach 35.5 µg/m3 (Unhealthy for Sensitive Groups), persons with heart and lung disease, as well as older adults and children are at greater risk from particle pollution while concentrations above 55.5 µg/m3 (Unhealthy) may cause adverse health effects for everyone. Above 250.5 µg/m3, particulate pollution becomes hazardous and may trigger emergency conditions (US EPA, 2016).
For the past 15 years, the Manila Observatory has been measuring the levels of PM2.5 in five Metro Manila sites and in one site in Calumpit, Bulacan during the New Year revelries. PM samplers were situated in the sites as shown in Figure 1: Manila Observatory, Quezon City, Barangka and Nangka, Marikina City, Antipolo City, Valle Verde 5, Pasig City, Almanza, Las Piñas City, and Calumpit, Bulacan. Figure 2 shows PM2.5 concentrations from 2003 to 2017 in each site plotted over the US EPA AQI categories. Samples were collected on filters for 24 hours starting from 12 noon of Dec 31. Concentrations in all Metro Manila sites reach levels that range from “unhealthy for sensitive groups” to downright “hazardous” to human health. Only the suburban site in Bulacan had a moderate classification. We also note that the highest PM2.5 concentrations were observed in Marikina sites where stable atmospheric conditions in the valley tend to trap pollution in the area.
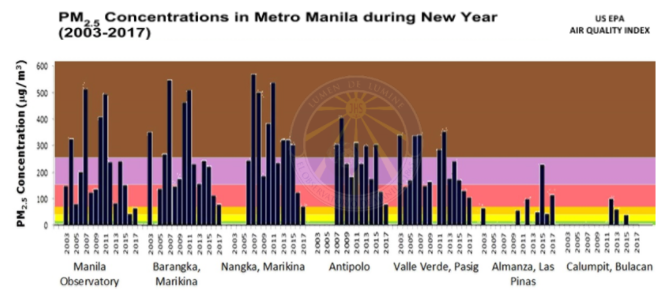
Figure 2. PM2.5 concentrations during New Year from 2003 to 2017. Samples were collected on the following sites: Manila Observatory, Quezon City; Nangka, Marikina City; Barangka, Marikina City; Oro Vista Royale, Antipolo City; Valle Verde 5, Pasig City; Almanza, Las Pinas City; and Calumpit, Bulacan.
Interestingly, with the exception of the Manila Observatory (MO) and Almanza, Las Piñas sites, the other four sites with consistently high measurements of PM2.5 showed lower concentrations this year. This coincides with reports that fireworks-related injuries in New Year 2017 were 60% lower than the 5-year average from 2011 to 2015 (DOH, 2017). Moreover, reports from Bocaue, Bulacan – the country’s fireworks manufacturing capital – state that sales of firecrackers have declined days before New Year 2017 (Sunstar Manila, 2016).
Figure 3 shows that in a span of 15 years, most of the PM2.5 concentrations during New Year’s Eve were distributed between “Unhealthy,” “Very Unhealthy,” and “Hazardous” levels. Although these high levels occur only during New Year’s Eve, both long-term and short-term exposure affect the human respiratory system (WHO, 2013). ‘”Long-term” may extend from months up to years while ”short-term” can span only a couple of days and even hours.
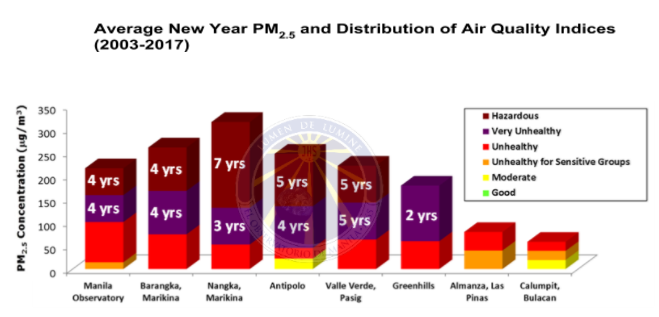
Figure 3. Average PM2.5 concentration from 2003-2017.
In addition to the 24-hour integrated filter-based PM2.5 concentrations, real-time data were also collected this year using two Location Aware Sensing System (LASS) sensors from Taiwan, which were placed indoors (Nangka, Marikina City and MO) and an Edimax Airbox, also from Taiwan, which was placed outdoors on the Manila Observatory (MO) West grounds. PM2.5 levels in the East section of the MO grounds were also continuously monitored using the Environmental Management Bureau’s (EMB) Grimm instrument. The LASS sensors and Grimm instrument provided 24 hourly PM2.5 concentrations starting from 12PM of 31 December, and therefore provided data with a much higher temporal resolution than the filter-based samples. Monitoring the hourly PM2.5 levels is essential particularly to individuals with lung and heart diseases, as well as to children and the elderly. If hourly PM2.5 levels are known, these groups could take steps to reduce their exposure to high levels of PM2.5. One way to reduce exposure is to minimize strenous activities that entail fast and deep breathing. Since particle pollution can penetrate indoors, vulnerable populations are also advised to stay indoors in an area with filtered air (US EPA, 2017).
Figure 4 shows that outdoor concentrations in the MO East Side (Grimm instrument) and MO West Side (Edimax Airbox) gradually increased from 6PM to 11PM, followed by a rapid increase which led to peak concentrations (341 µg/m3 and 363 µg/m3) at 2AM and 3AM, respectively. Normal levels (below 50 µg/m3) were back by 10AM on New Year’s Day in both MO West and MO East side. This is comparable to the hourly average levels obtained during the normal days of year 2016.
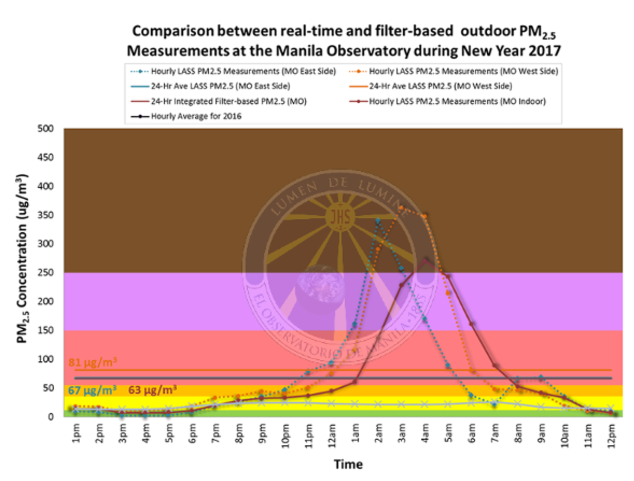
Figure 4. Hourly average PM2.5 concentrations measured at the Manila Observatory
A similar trend was observed by the sensor placed indoors except that the peak concentration was reached an hour later compared to the sensor placed directly outdoors (MO West Side). Outdoor particles may significantly contribute to the concentration of indoor particles (Chow, 2002). Figure 4 showed that high levels of PM2.5 were also observed indoors with a maximum concentration of 271 µg/m3. While this figure is lower relative to the outdoor value (MO West side), it is still significant and might be due to the building shell, the particle penetration efficiency, and the particle deposition rate, which are the primary factors affecting the transport of ambient particles indoors as stated in a study done by the California Air Resource Board (2004). An elevated level of PM2.5 concentration was observed both indoors and outdoors from 1PM to 5PM. When the outdoor concentration started to increase, the indoor concentration level increased shortly thereafter. This suggests that ambient particles were transported indoors in a very short span of time. This might be true only for the MO indoor/outdoor environment, where outdoor particles are the main contributor to the indoor particle concentration. This trend may not be similar to other indoor/outdoor environments like households. Factors like construction materials used, type of ventilation, and use of appliances may affect the relationship between indoor and outdoor PM concentrations in households. We also note that leading up to the New Year revelries beginning at 9PM on 31 December up to about 12 hours later (9 AM on 01 January), both the indoor and outdoor PM2.5 concentrations already ranged between the levels deemed by the AQI as “Unhealthy for Sensitive Groups” to outright “Hazardous” (Figure 4). This result suggests that both the decline in the atmospheric boundary layer during night time and the emission of particulates from the fireworks contributed to the observed trend in the hourly PM2.5 levels during this period.
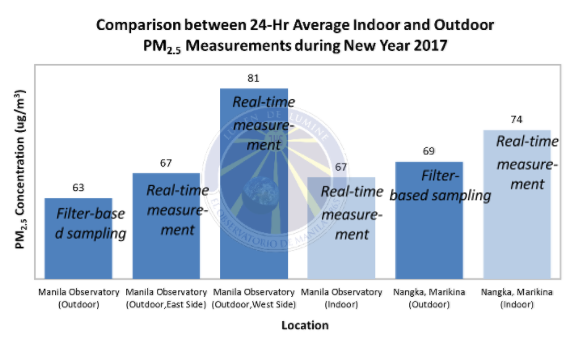
Figure 5. Average PM2.5 concentrations measured indoors and outdoors at the Manila Observatory and in Nangka, Marikina
Figure 5 shows that including uncertainties between the two techniques, average values of the 24 hourly concentrations measured by the real-time sensors agree well with the concentrations measured by the collocated integrated filter-based sampling method. Additionally, comparable PM2.5 levels indoors (24-hr average of 67 µg/m3 at the MO indoor site) and outdoors (24-hr average of 67 and 81 µg/m3 from MO East and MO West, respectively) imply that a person’s exposure to particulate pollution during New Year’s Eve is the same whether indoors or outdoors at the MO measurement site. We also observed the same trend for both the indoor and outdoor measurements at the Nangka, Marikina site.
Visibility
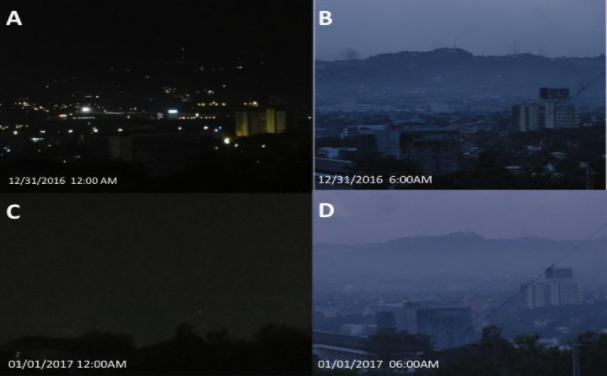
To clearly see the effect of fireworks with regards to visibility, photos were taken at the rooftop of Manila Observatory, with an overlooking view of the Marikina Skyline and the Sierra Madre Mountain Range in Rizal area as seen in Figure 7. Photos A & B show higher visibility as observed before the start of the New Year festivities. In photos C & D, the air became visibly hazy and there is a lower visibility during and after the New Year festivities due to increased PM2.5 concentrations. Burning firecrackers elevate the amount of particulate matter in the air. Fine particles can penetrate through our lungs and exposure to fine particles can cause serious health problems.

Figure 7. Upper left then clockwise – Skyline of Marikina City before, during and after the New Year festivities. Photos courtesy of Ms. Genevieve Lorenzo.
Implications of Firework ban on PM2.5 concentrations
With the new administration slowly implementing the total fireworks ban, the New Year celebration for 2017 was not as extravagant as in previous years. As reported by the Philippine Daily Inquirer (Gutierrez et al., http://newsinfo.inquirer.net/857827/firecracker-makers-greet-impending-ban-with-gloom, accessed 24 Mar 2017), the total firework ban has been pushed back due to the late submission of proposal by the Department of Health. With firecrackers already in production for the seasonal rush, abruptly stopping distribution of the products could lead to financial setbacks, especially for those who run small operations. The report also noted that it will be harmful to put manufactured firecrackers in storage. Pushing back the implementation of total firework ban to 2017 will give manufacturers enough time to adjust. With its possible implementation for New Year 2018, we expect to observe notable decrease in PM2.5 concentrations and a cleaner air to welcome our new year.
References
Calayag, K.A., 2016. Firecrackers sales in Bulacan decline, Sunstar Manila. Retrieved from http://www.sunstar.com.ph/manila/local-news/2016/12/30/firecrackers-sales-bulacan-decline-517581
California Air Resource Board Research Division, 2004. Detailed Characterization of Indoor and Personal Particulate Matter Concentrations- Final Report. Contract No. 00-302.
Cardiovascular Disease and Air Pollution, 2006. A report by the Committee on the Medical Effects of Air Pollutants. Retrieved from https://www.gov.uk/government/publications/comeap-cardiovascular-disease-and-air-pollution
Gutierrez, J., Aning, J., and Santos, T., 2016. Firecracker makers greet impending ban with gloom. Retrieved from http://newsinfo.inquirer.net/857827/firecracker-makers-greet-impending-ban-with-gloom
Kim, K.H., Kabir, E., and Kabir, S., 2015. A review on the human health impact of airborne particulate matter. Environment International, Vol. 74, pp. 136-143.
Moreno, T., Querol, X., Alastuey, A., Minguillon, M.C., Pey, J., Rodriguez, S., Miro, J.V., Felis, C., and Gibbons, W., 2007. Recreational atmospheric polluiton episodes: Inhalable metalliferous particles from firework displays. Atmospheric Environment, Vol 41, Issue 5, pp.913-922.
U.S Environmemntal Protection Agency (USEPA), 2004. The Particle Pollution Report. Current Understanding of Air Quality and Emissions through 2003.