By Grace Betito, Gabrielle Leung, Paola Angela Bañaga, Miguel Ricardo A. Hilario, Genevieve Rose Lorenzo, Zenn Marie Cainglet, Aubrey May De Francisca, Xzann Garry Vincent Topacio, Imee Delos Reyes, Melliza Cruz, Rachel Braun, Alexander McDonald, Connor Stahl, Nofel Lagrosas, Maria Obiminda Cambaliza, James Bernard Simpas, Gemma T. Narisma, Armin Sorooshian, Robert Holz, Ed Eloranta, Ilya Razencov, Fr. Jose Ramon Villarin, SJ, and Fr. Daniel McNamara, SJ
Summary:
- Long-term PM2.5 measurements show New Year’s Eve air quality improved since 2003, but still unhealthy in most sites in & around Metro Manila.
- Real-time PM2.5 measurements show fine particulate concentrations drastically increased an hour after New Year’s eve to unhealthy levels. During these times, even relatively healthy people should stay indoors and avoid exposure to such pollution.
- Remote-sensing measurements confirm aerosol backscatter within the surface layer was lower than last year’s New Year, in part due to meteorology.
- Firework emissions show distinct size properties from regular traffic-related pollution, with ions like potassium, nitrate, and chloride more likely to be deposited deep in people’s respiratory systems due to their small sizes.
Filipinos traditionally celebrate New Year’s eve by setting off loud and colorful displays of fireworks. However, health and environmental groups in the country have long campaigned for the halting of this tradition, since New Year’s Eve fireworks contribute to the spike in air pollution and fireworks-related injuries. Fireworks are known to have perilous effects on our health and the environment (Barman et al., 2009). Aside from the possible lethal injuries when used improperly, fireworks also emit harmful particulates and gases into the atmosphere (Drewnick et al., 2006). Studies have shown that burning of fireworks releases elevated concentrations of hazardous pollutants such as sulfur dioxide (SO2), nitrogen oxide (NO2), PM, metals like aluminum, and water-soluble ions (Greven et.al., 2019; Wang et al., 2007). Particulate matter (PM) (a mixture of solid particles and liquid droplets found in the air) from such events were mainly in the fine mode, more commonly known as PM2.5 (PM with diameters about 2.5 micrometers or less). PM of this size are small enough to be inhaled and deposited into the deeper parts of the lungs (Kim et al., 2015). A number of studies even link the short-term exposure to PM2.5 and other firework-related pollutants with several adverse health effects, including cardiovascular morbidity, increased hospital admissions for heart or lung causes, and even higher risks for fatal respiratory diseases such as pneumonia (Greven et.al., 2019, California Air Resources Board, 2020).
Due to these critical health effects, the Manila Observatory has been monitoring the air quality during New Year’s Eve celebrations since 1998. Before New Year’s Eve 2019 (31 Dec 2019), filter-based PM2.5 samplers were deployed in six different sites: (1) Manila Observatory, Quezon City; (2) Barangka, Marikina; (3) Nangka, Marikina; (4) Antipolo; (5) Valle Verde, Pasig; and (6) Almanza, Las Pinas. Moreover, the Micro-Orifice Uniform Deposit Impactor (MOUDI) was installed at the Manila Observatory to analyze relevant changes in the mass size distribution and chemical composition. This year, there were also real-time personal samplers installed in five sites: (1) Manila Observatory, Quezon City; (2) Congressional Avenue, Quezon City; (3) Batasan Hills, Quezon City; (4) Barangka, Marikina; and (5) San Jose del Monte, Bulacan as indicated in Figure 1. In the filter-based sampling, particles are deposited on a filter media for a certain number of hours and then analyzed for their mass and chemical composition. One disadvantage of this sampling method is it can only provide an average value over a given sampling time. On the other hand, real-time PM samplers can provide continuous, real-time data with higher resolution. The drawback of this method is that further chemical composition analysis is not possible. To fully understand the behavior and characteristics of PM, the use of both methods is recommended.
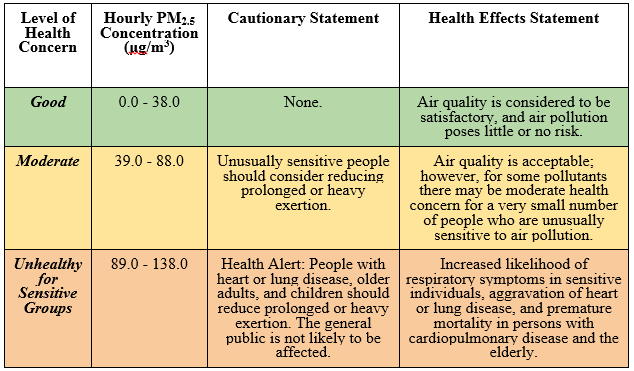
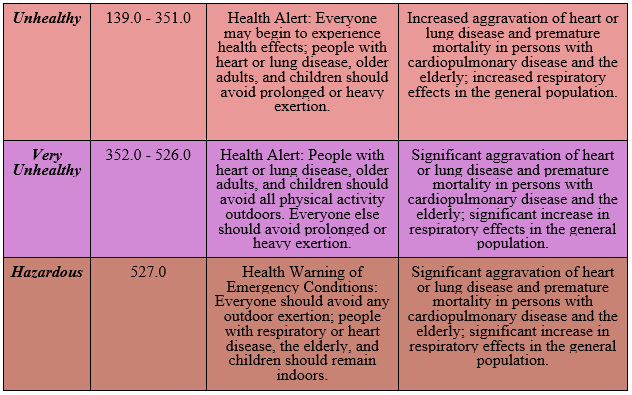
As in the previous reports, PM2.5 measurement levels were compared with the corresponding US EPA Air Quality Index (AQI) categories. The complete descriptions can be found in Appendix Tables 1 and 2. The AQI serves as an indicator of air quality and provides the associated health risk for exposure to a given PM2.5 concentration (MO report, 2019). Twenty-four-hour average PM2.5 concentrations above 35.5 μg/m3 are classified as “unhealthy for sensitive groups” while values above 250.5 μg/m3 (“hazardous”, colored in brown) are completely unsafe for people of all ages. During “hazardous” events, everyone is recommended to stay indoors and away from the pollution source and to filter the air. Hourly PM2.5 concentrations (Table 2) above 89.0 μg/m3 are unhealthy for sensitive groups, while PM2.5 concentrations above 527.0 μg/m3 are hazardous for all people.
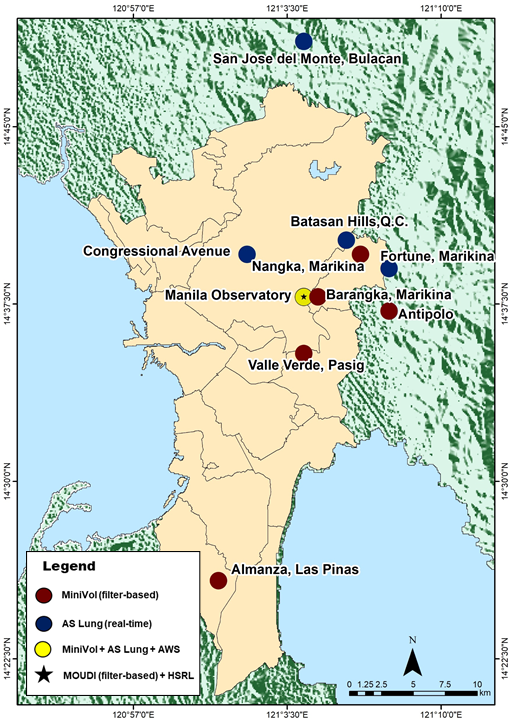
Figure 1. Particulate matter (PM) filter-based and continuous sampling locations. The legend indicates the type of instrument used for each site. Minivol samplers for 24-hour sampling were deployed at six sampling sites: (1) Manila Observatory; (2) Barangka, Marikina; (3) Nangka, Marikina; (4) Antipolo; (5) Valle Verde, Pasig; and (6) Almanza, Las Pinas. AS-Lung personal samplers for real-time continuous sampling were installed at five sites: (1) San Jose del Monte, Bulacan; (2) Batasan Hills, Q.C; (3) Congressional Ave., Q.C; and (5) Fortune, Marikina. Also installed in Manila Observatory is the University of Arizona’s Micro-Orifice Uniform Deposit Impactor (MOUDI) and University of Wisconsin’s High Spectral Resolution Lidar (HSRL).
Long-term PM2.5 measurements show New Year’s Eve air quality improved since 2003, but still unhealthy in most sites.
Figure 2 clearly shows there is a decreasing trend in PM2.5 concentrations for the majority of the sampling sites (Manila Observatory, Barangka, Marikina, Valle Verde and Almanza, Las Pinas) in the past three years. In general, the air quality in Metro Manila during New Year’s Eve is improving.
Minivol Tactical Air Sampler (TAS), a filter-based instrument with a 5 L/min flow rate, was used to measure PM2.5 concentrations for 24 hours from 12:00 p.m. 31 December to 12:00 p.m. 1 January. It is important to note that this year, the sampler in Barangka, Marikina ran for 19.6 hours only, which is shorter than the other samplers that completed the 24-hour sampling. Interestingly, a significant air quality improvement was observed at Las Piñas, where PM2.5 concentration levels improved from the “unhealthy” level last year to the “good” category this year. On the other hand, an increase in PM2.5 concentration was observed at Antipolo and Nangka, Marikina.
Although there seems to be a considerable decrease in the average PM2.5 concentration for the past three years, this New Year’s Eve pollution levels in all sites except Las Piñas remained “unhealthy” according to the US EPA 24hr standard. This means that PM exposure at this level may still pose health risks, especially to sensitive individuals (e.g. children, elderly, people with respiratory conditions). Even though there have been significant improvements in reducing air pollution during New Year’s Eve, more progress is still necessary to maintain safe levels of air quality.
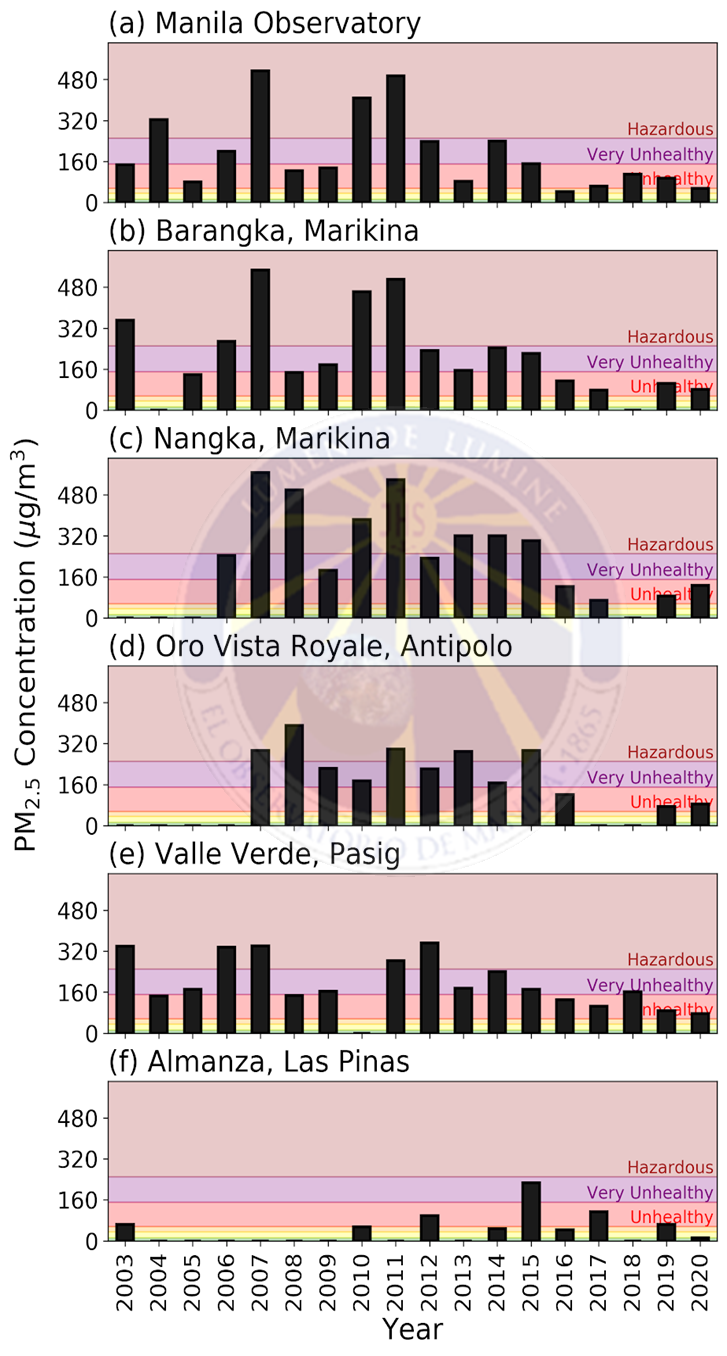
Figure 2. 24-hour average PM2.5 concentrations (µg/m³) during New Year’s from 2003 to 2020. Samples were collected from 12 p.m. 31 December to 12 p.m. 1 January using portable MiniVol samplers at the following sites: (a) Manila Observatory, Quezon City; (b) Barangka, Marikina City; (c) Nangka, Marikina City; (d) Oro Vista Royale, Antipolo City; (e) Valle Verde 5, Pasig City; and (f) Almanza, Las Piñas City. Plotted over the United States Environmental Protection Agency (US EPA) 24-hour PM2.5 standards (Table 1, Appendix).
Real-time PM2.5 measurements show fine particulate concentrations drastically increased an hour after New Year’s eve
To keep track of PM2.5 concentrations at a higher temporal resolution (about 15 seconds), AS-Lung portable sensors were also deployed in select areas in Metro Manila, and Bulacan (Figure 1). Four AS-Lung portable sensors collected outdoor air samples: one placed at the balcony of the Manila Observatory, and three situated near windows in Barangay Fortune, Marikina, San Jose del Monte, Bulacan, and Batasan, Quezon City. On the other hand, one AS-Lung portable sensor was installed indoors in Congressional Ave., Quezon City. As seen from Figure 3, differences in the start-time and end-time among the sampling locations do not necessarily affect the overall data since measurements in all sites covered the New Year’s Eve period.
In Manila Observatory and Brgy. Fortune where sampling times were almost parallel, the PM2.5 concentration gradually increased around 6:00 p.m. to 10:00 p.m, then reached a dramatic peak an hour after midnight. Outdoor sampling in Bulacan and Batasan began later than the aforementioned sites but reflected a similar concentration peak around 1:00 am to 2:00 am. Low wind speeds registered near the Batasan site could have caused firework emissions to stagnate in the area. During the New Year, there was no rain recorded, implying that there was no washout of particulates at that time.
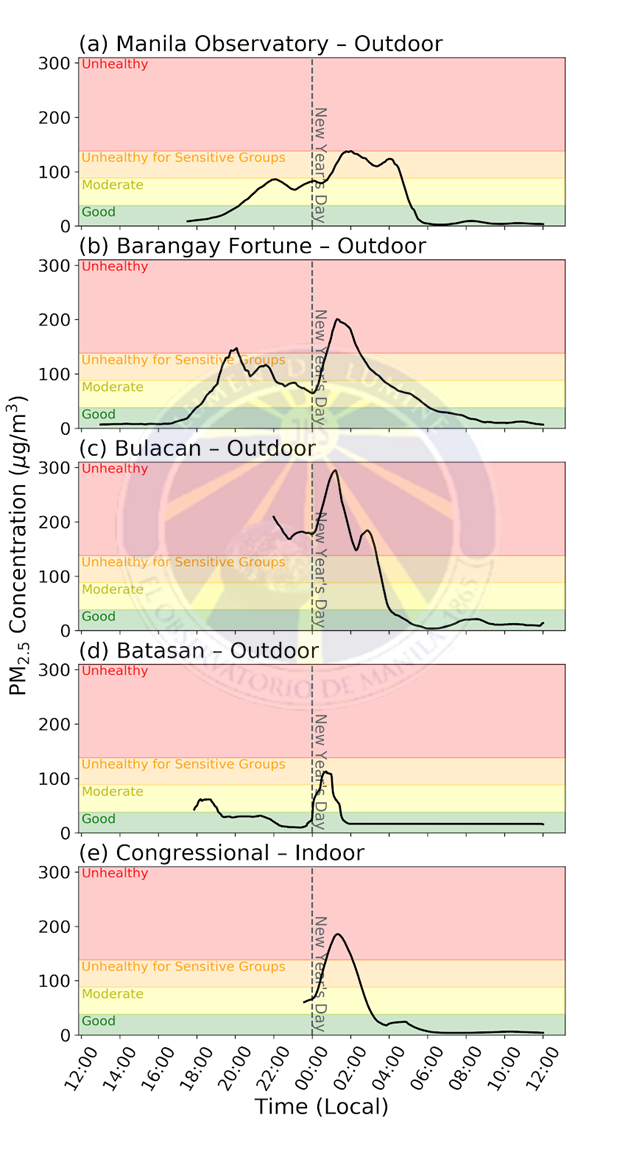
Figure 3. Hourly average PM2.5 concentrations (µg/m³) from 12:00 p.m. 31 December 2019 to 12:00 p.m. 1 January 2020 from AS-Lung portable PM2.5 samplers located in (a) Manila Observatory, Quezon City; (b) Barangay Fortune, Marikina City; (c) Batasan, Quezon City; (d) Congressional, Quezon City; (e) San Jose del Monte, Bulacan. Plotted over the United States Environmental Protection Agency (US EPA) hourly PM2.5 standards (Table 2, Appendix).
The PM concentration levels at MO was maintained within the range of 39-140 µg/m3 which is qualified as “unhealthy for sensitive groups” (US EPA AQI for hourly PM2.5 concentrations) for 3 hours from 12:00 a.m. – 3:00 a.m. During this time people with heart or lung disease, older adults, and children, should reduce prolonged or heavy exertion. During the time of the peak in concentration at MO, the winds were coming from the west side, but were relatively weak (wind speed shows near-zero values) (Figure 4). Last year’s concentrations reached the “very unhealthy” level due to higher wind speed coming from the northeast side of MO, the Marikina Valley, with relatively higher firework activity compared to the west side of MO.
In Barangay Fortune and Congressional, the concentration levels increased to 200 µg/m3, which qualifies as Unhealthy (US EPA AQI for hourly PM2.5 concentrations) The unhealthy concentrations lasted for almost 2 hours during the firework events from 12:00 a.m. – 2:00 a.m. Figure 3 also shows that even before the height of New Year’s Eve celebration, concentrations in Brgy. Fortune was already unhealthy, especially for those people with respiratory concerns, older adults, and children. People with heart or lung disease, older adults, and children should avoid prolonged or heavy exertion during times like these. The PM2.5 peak concentration in Bulacan also lasted for 2 hours.
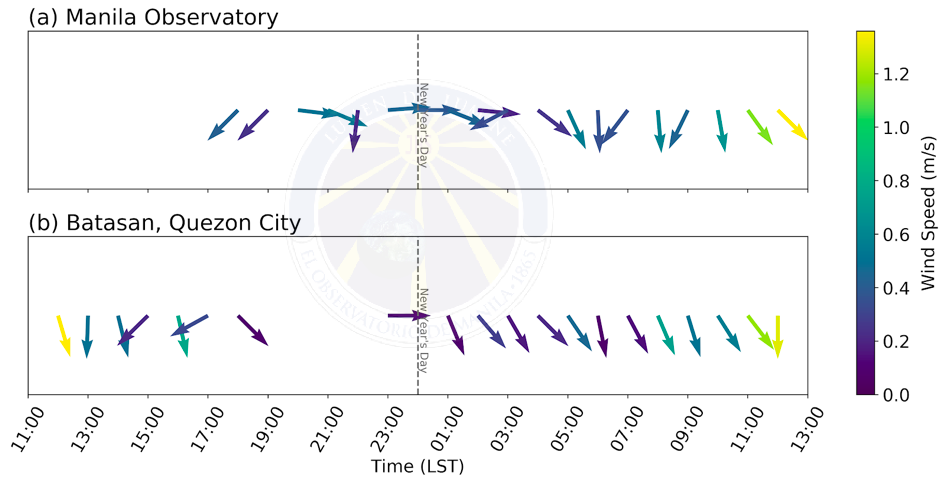
Figure 4. Wind speed and direction (arrows point to the direction where the wind is blowing towards) at a) Manila Observatory and b) Batasan, Quezon City from December 31 (12nn) to January 1 (12nn)
Remote-sensing measurements confirm aerosol backscatter within the surface layer was lower than last year’s New Year, in part due to meteorology.
In addition to data from the in-situ PM2.5 samplers, a High Spectral Resolution Lidar (HSRL) was also operating and collecting vertically-resolved remote-sensing data at the Manila Observatory site. The HSRL measures a property called backscatter, which is a quantification of how much light from a laser pointed into the atmosphere is reflected back to the surface. The magnitude of the backscatter is related to the amount of atmospheric constituents causing the light to be sent back to the ground; higher backscatter generally is indicative of a higher concentration of aerosols (depending on the shape and radii of the aerosols as well).
Figure 5 shows the aerosol backscatter measured by the HSRL from 12:00 n.n. 31 Dec 2019 to 12:00 n.n. 1 Jan 2020, at altitudes ranging from surface to 15km (top panel) and 3km (bottom panel). Note that there is a band of missing data from 11:00-11:50 p.m. 31 Dec 2019 when the HSRL was conducting its calibration cycle, and no data was collected. In the top panel, the general structure of the atmosphere on the evening of 31 Dec 2019 can be observed, with a clear layer from the surface to about 2km being topped with clouds, and corresponding to moderate enhancements in aerosol backscatter due to the presence of residual pollutants from the previous days. Right after midnight, though, there is an enhancement in the backscatter near the surface to ~250m. This enhancement is more likely related to the firework emissions, since it originates in the surface layer and coincides with the in-situ measurements measured above.
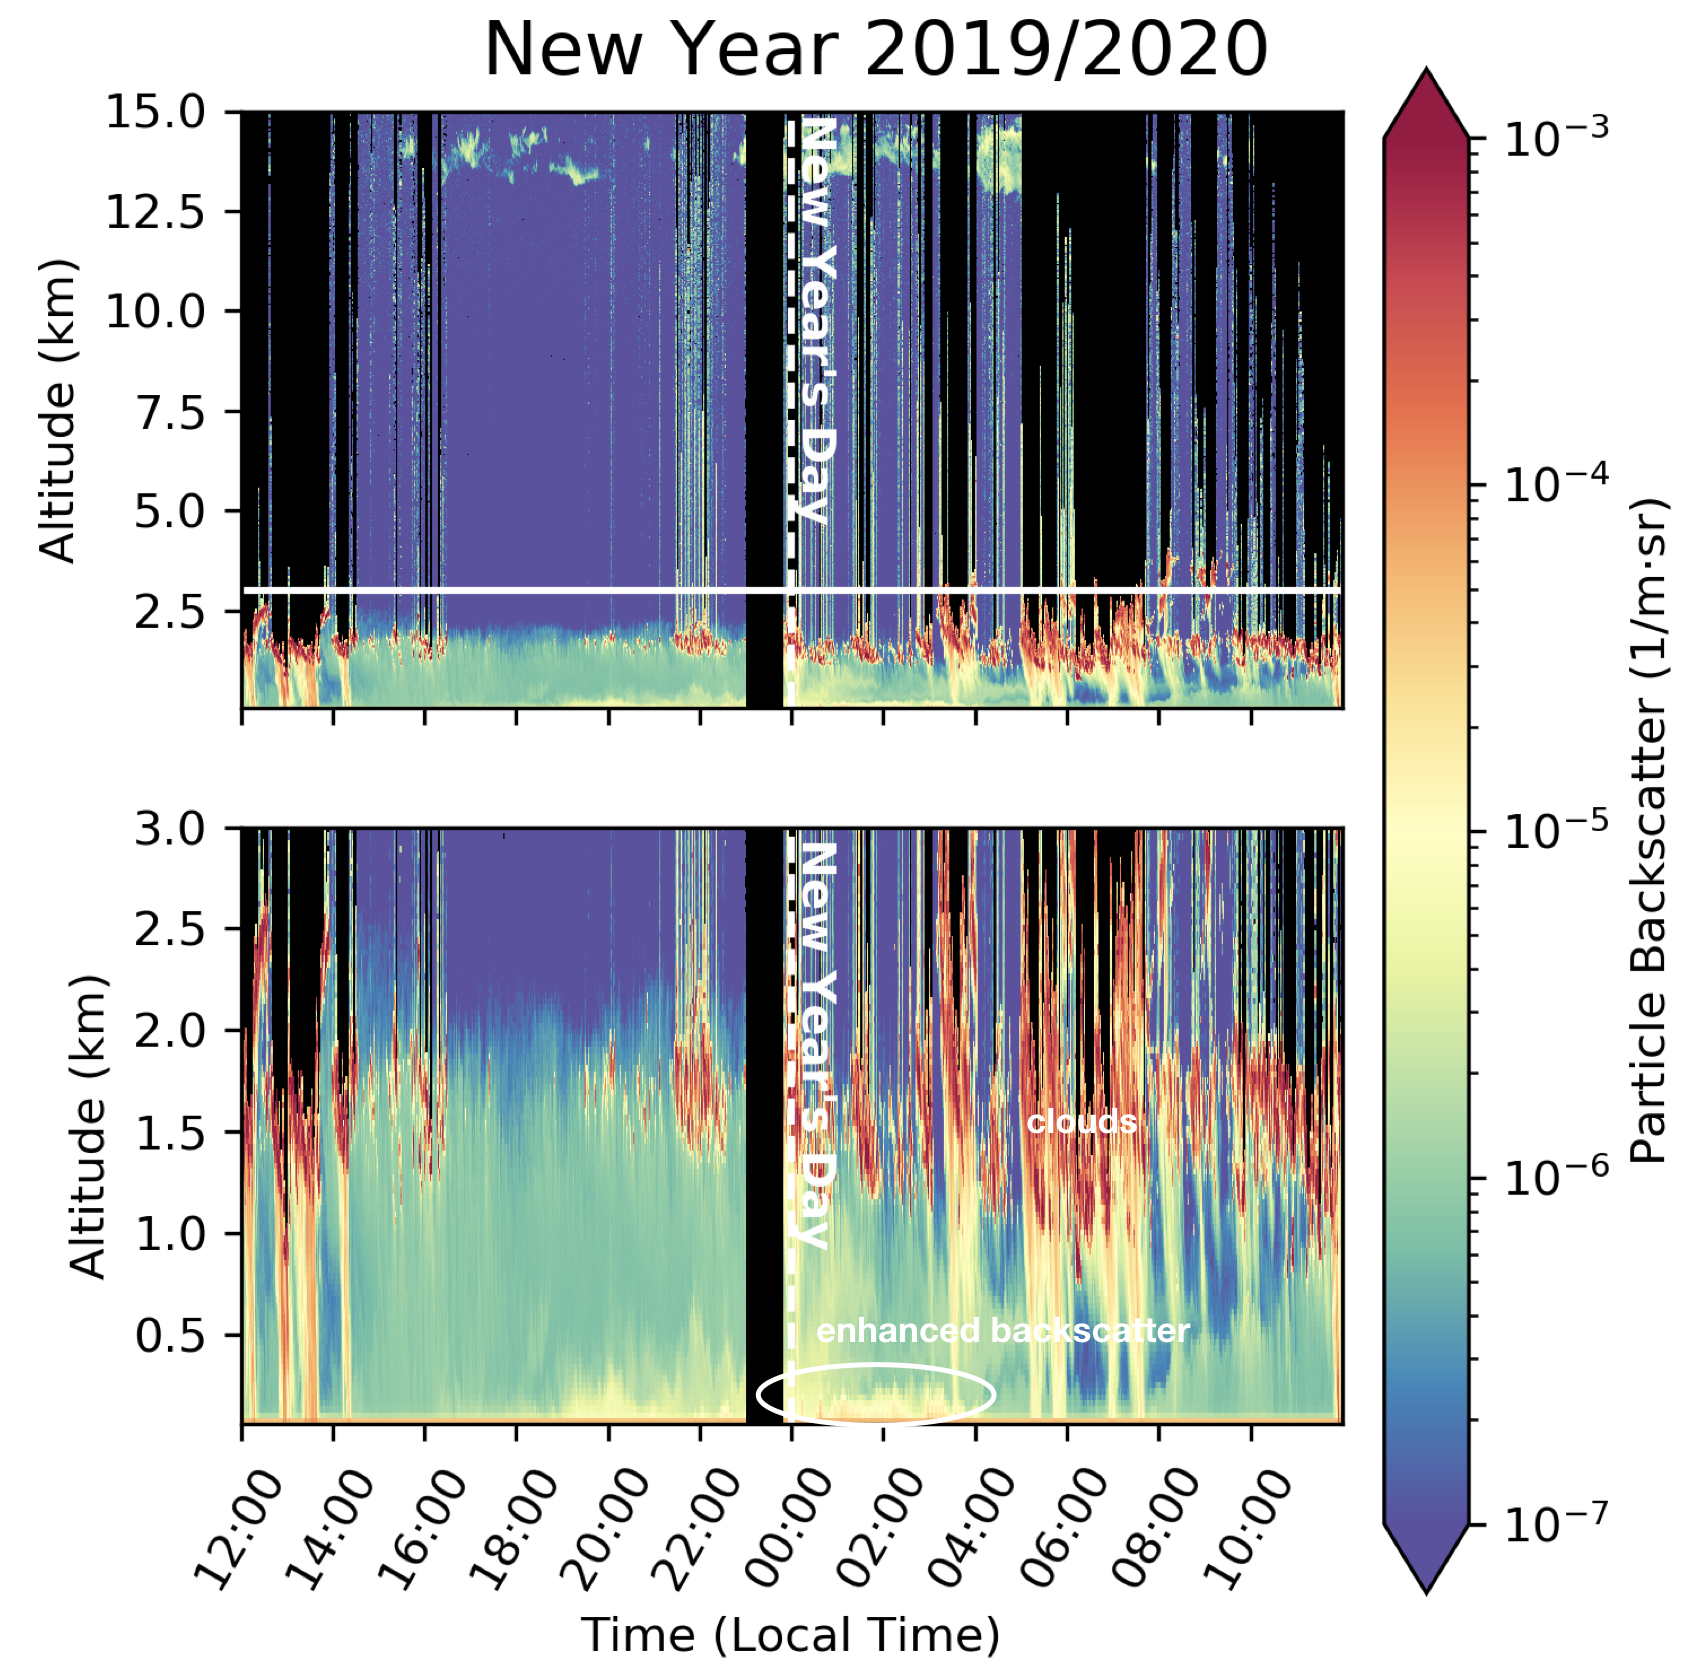
Figure 5. Aerosol backscatter measured by HSRL from 12:00 n.n. 31 Dec 2019 to 12:00 n.n. 1 Jan 2020 (local time) at altitudes from (top) surface to 15km, and (bottom) surface to 3km. Areas shaded in black are masked out due to attenuation of the HSRL beam. No data was obtained from 11:00-11:50 p.m. 31 Dec 2019 due to the instrument’s calibration cycle.
However, compared to last year’s New Year, this year we had noticeably lower enhancements in aerosol backscatter. Figure 6 shows aerosol backscatter from last year’s New Year compared to this year. Meteorological factors cause large differences in the profiles: last year, there were frequent rains throughout the afternoon and evening, and the atmosphere was relatively stable with very little to no enhancements in the nocturnal residual layer. However, in the surface level below ~200m right after midnight, there were huge increases in the aerosol backscatter. These increases were much larger than those that were observed around the same time this year. Again, this is consistent with in-situ PM2.5 measurements, which indeed show a decrease in ambient concentrations. Although we cannot directly quantify whether use of fireworks has been actually going down, this emphasizes that decreased concentrations are due to a combination of possible reduced emissions and meteorological factors.
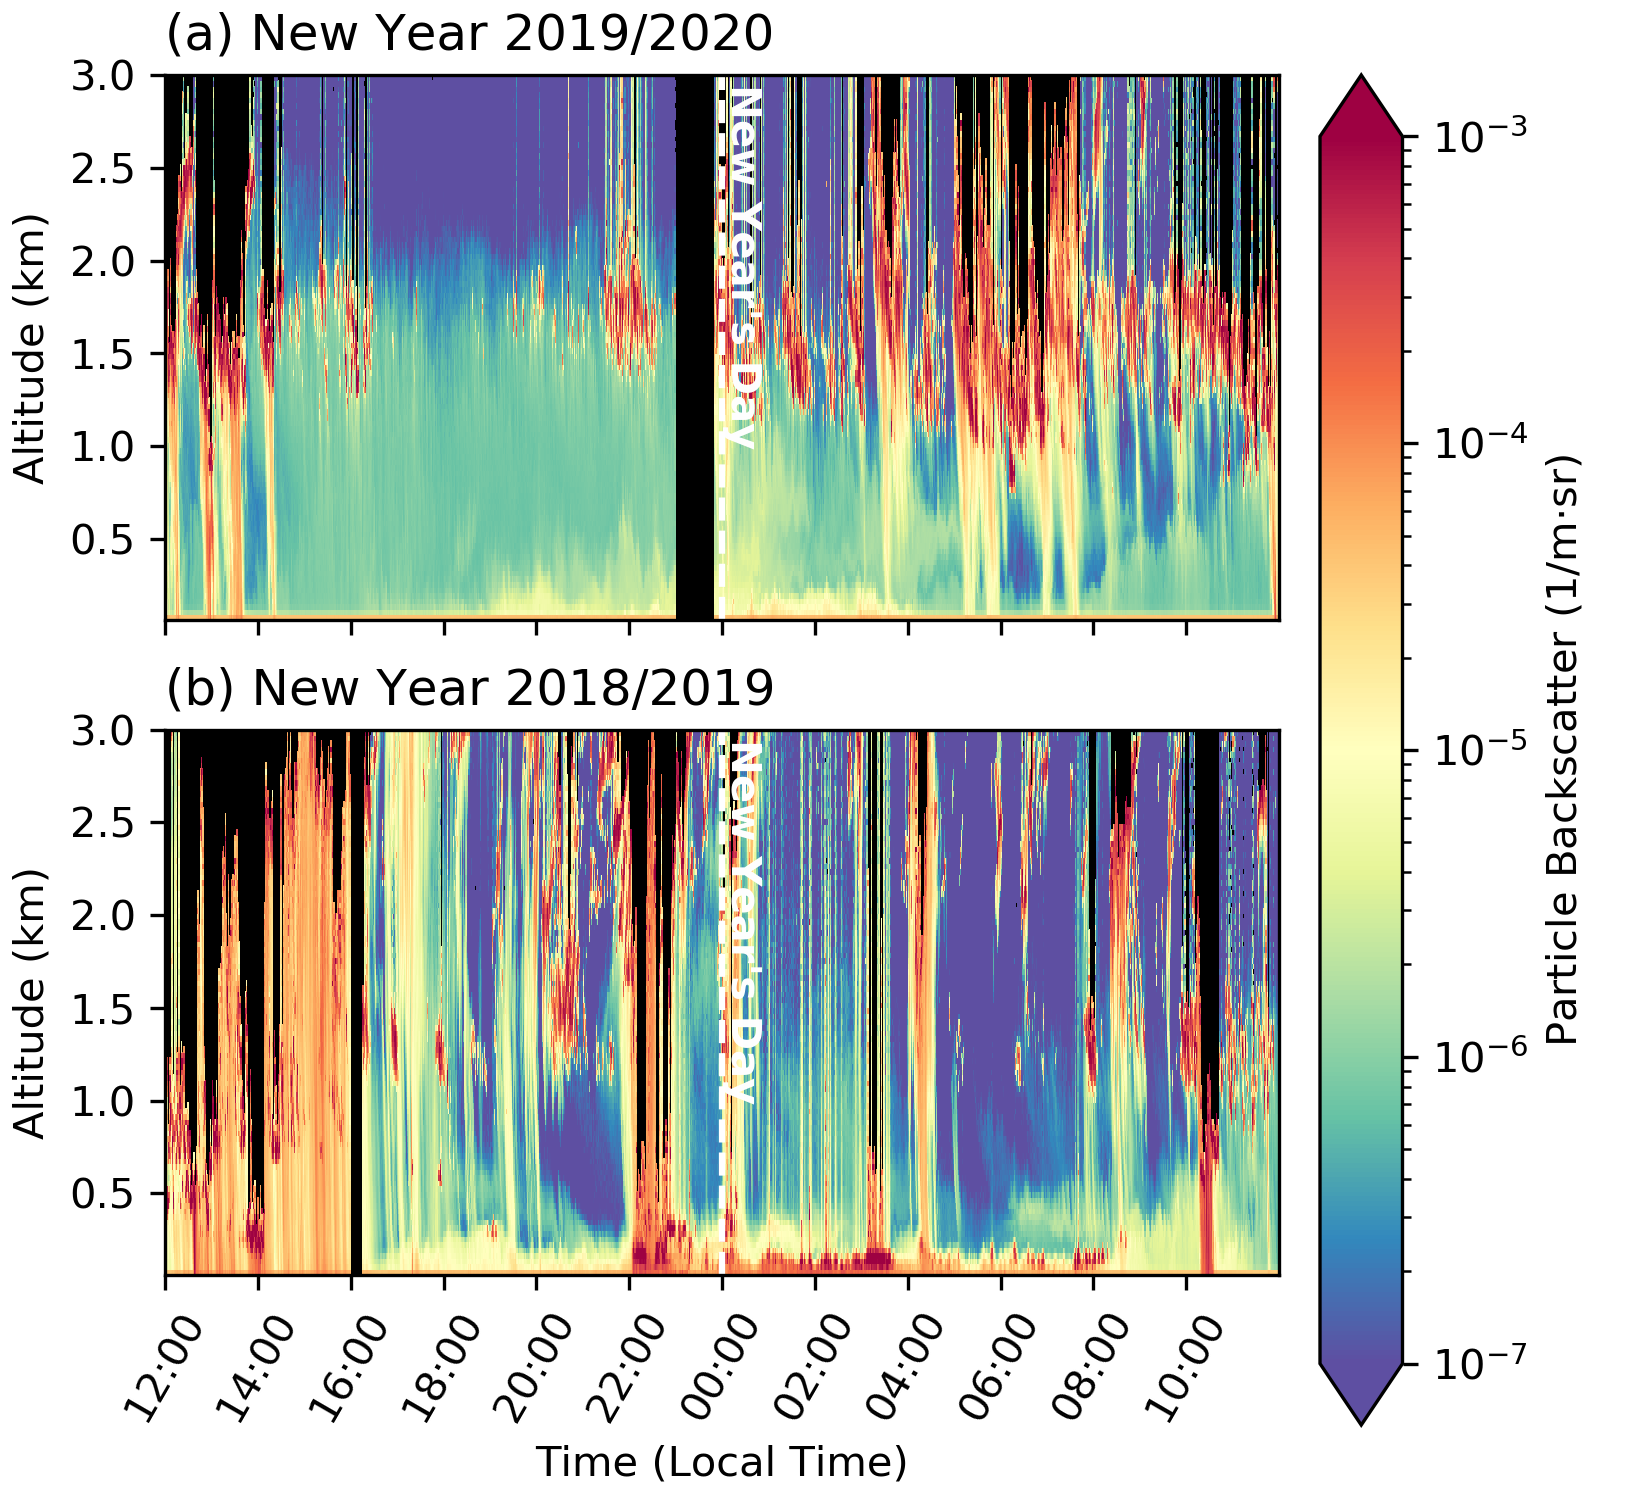
Figure 6. Aerosol backscatter measured by HSRL from (top) 12:00 n.n. 31 Dec 2019 to 12:00 n.n. 1 Jan 2020 (local time) and (bottom) 12:00 n.n. 31 Dec 2018 to 12:00 n.n. 1 Jan 2019 at altitudes from surface to 3km. Areas shaded in black are masked out due to attenuation of the HSRL beam. No data was obtained from 11:00-11:50 p.m. 31 Dec 2019 due to the instrument’s calibration cycle.
Firework emissions show distinct size properties from regular traffic-related pollution, with ions like potassium, nitrate, and chloride more likely to be deposited deep in people’s respiratory systems.
Apart from the measurements of total PM2.5 concentrations, size-segregated daytime and nighttime PM was also collected using a Micro-Orifice Uniform Deposit Impactor (MOUDI) operating at 30L/min at the following aerodynamic cutpoint diameters (Dp): 0.056, 0.10, 0.18, 0.32, 0.56, 1.0, 1.8, 3.2, 5.6, 10, and 18 µm. The sampling time was separated into the daytime (6:00 a.m. to 5:00 p.m.) and nighttime (6:00 p.m. to 5:00 a.m. (first 2 days) and 6:00 p.m. to 6:00 a.m. (third day)). Sample sets were collected for three consecutive days (31 Dec-2 Jan, daytime; 31 Dec-3 Jan, nighttime) for a total runtime of 33 (daytime) and 34 (nighttime) hours. Mass concentration for each size-range was obtained by pre-weighing and post-weighing each filter. The PM mass collected during the New Year was then compared with those collected during a Regular day (4-6 Dec 2019).
The daytime and nighttime PM levels during New Year’s day and Regular day are shown in Figure 7. During both events, nighttime PM concentrations were considerably higher than during the daytime. This can be explained by cooler nighttime ambient temperatures in December that contribute to shallower nighttime boundary layers (i.e. the concentrations accumulate in a smaller volume, which leads to higher concentrations). Cool nights can make the atmosphere more stable, making the mixing layer height shallower, which reduces particle dispersion. Conversely, stronger thermal convection (increased in mixing) occurs during the daytime promoting aerosol particle dispersion, which leads to lower surface aerosol concentrations (Vecchi et al., 2007, Chatterjee et al., 2013).
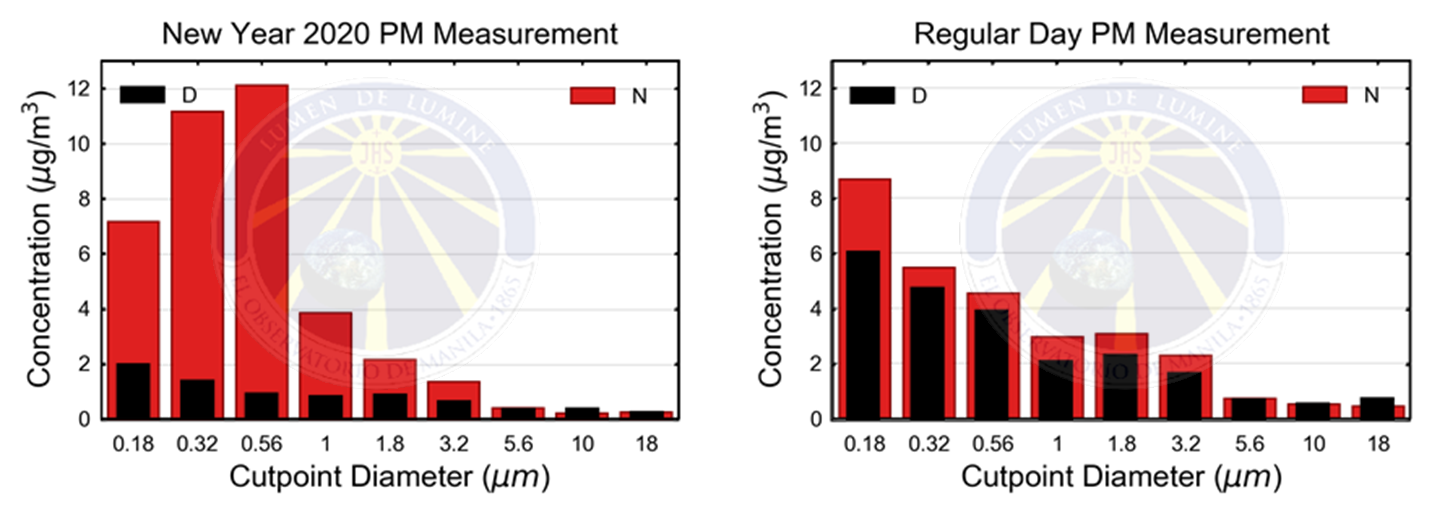
Figure 7. Daytime (D) and nighttime (N) mass size distributions of total PM during (left) New Year’s Day celebration (D: 31 Dec-02 Jan; N: 31 Dec-03 Jan); and (right) Regular day (D: 04-06 Dec; N: 04-07 Dec).Daytime sample collection was started at 6:00 a.m. and ended at 5:00 p.m. while the nighttime sample collection was started at 6:00 p.m. and ended at 5:00 a.m. (first 2 days) and 6:00 a.m. (third day).
During the New Year nighttime sampling, the PM mass exhibited the highest peak between 0.56-1.0 µm. The daytime PM peaks between 0.18-0.32 µm similar to what is observed for the Regular day samples. New Year’s daytime and Regular daytime & nighttime samples exhibited a bimodal behavior with a second minor peak between 1.8-3.2 µm. On Regular day, when comparing the day and night PM mass distribution, no major difference was observed. Both the day and night samples exhibited concentration peaks between 0.18-0.32 µm, which is characteristic of traffic and other mobile sources (Cruz et al., 2019). During the New Year sampling, though, there is a large difference between the size distributions of the daytime and nighttime sampling. This difference clearly shows the impact of firework emissions during nighttime. Because it was a non-working holiday and classes are on recess, anthropogenic emissions such as industrial activity and traffic should only minimally contribute to the drastic increase in pollution during this period. Thus, the increase in PM levels (0.18 – 1.0 µm) during nighttime can be attributed to firework emissions (Yang et al., 2014).
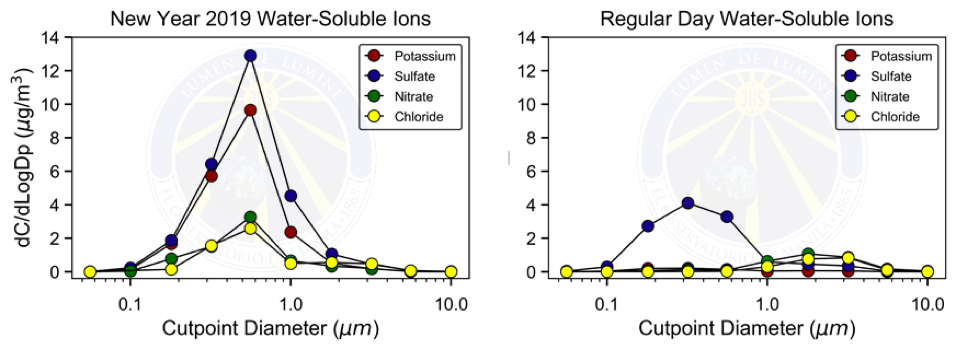
Figure 8. (left) Mass size distribution of selected water-soluble ions during the New Year 2019; and (right) water-soluble ions averaged over 22 regular sample sets collected from 19 July – 17 Dec 2019.
Analysis of the chemical composition of 2-day samples from last year’s New Year fireworks event (2019) is shown in Figure 8. This information can further confirm that the increase in particulate matter measured is related to the fireworks. The smoke produced by fireworks releases large amounts of water-soluble species including potassium (K), sulfate (SO42-), nitrate (NO3–), and chloride (Cl–) (Retama et al., 2019). High concentrations of these species are common during firework episodes. As shown in Figure 8 (left), the K, SO42-, NO3–, Cl–, have registered the highest peak between 0.56-1.0 µm similar to what was observed for the New Year 2020 PM mass. NO3– and Cl– shifted towards smaller size ranges (from 1.8 µm to 0.56 µm), while K and SO42- shifted towards larger size ranges (from 0.32 µm to 0.56 µm). A similar shift in the SO42- peak was also reported in a study in California for samples impacted by biomass burning (Maudlin et al., 2015). On Regular days (Figure 8 right) without the influence of firework emissions, the NO3– and Cl– commonly peaked between 1.8-3.2 µm, while SO42- and K is more dominant in the submicrometer mode (0.32-0.56 µm) (Cruz et al., 2019). The smaller sizes of species associated with firework emissions means they will be deposited more deeply into our respiratory system. These water-soluble ions can cause severe respiratory effects, especially for sensitive groups.
Although New Year’s Eve fireworks cause short-lived pollution events, exposure to these levels still poses a serious health risk for people with pre-existing respiratory diseases (Tanda et al., 2019).

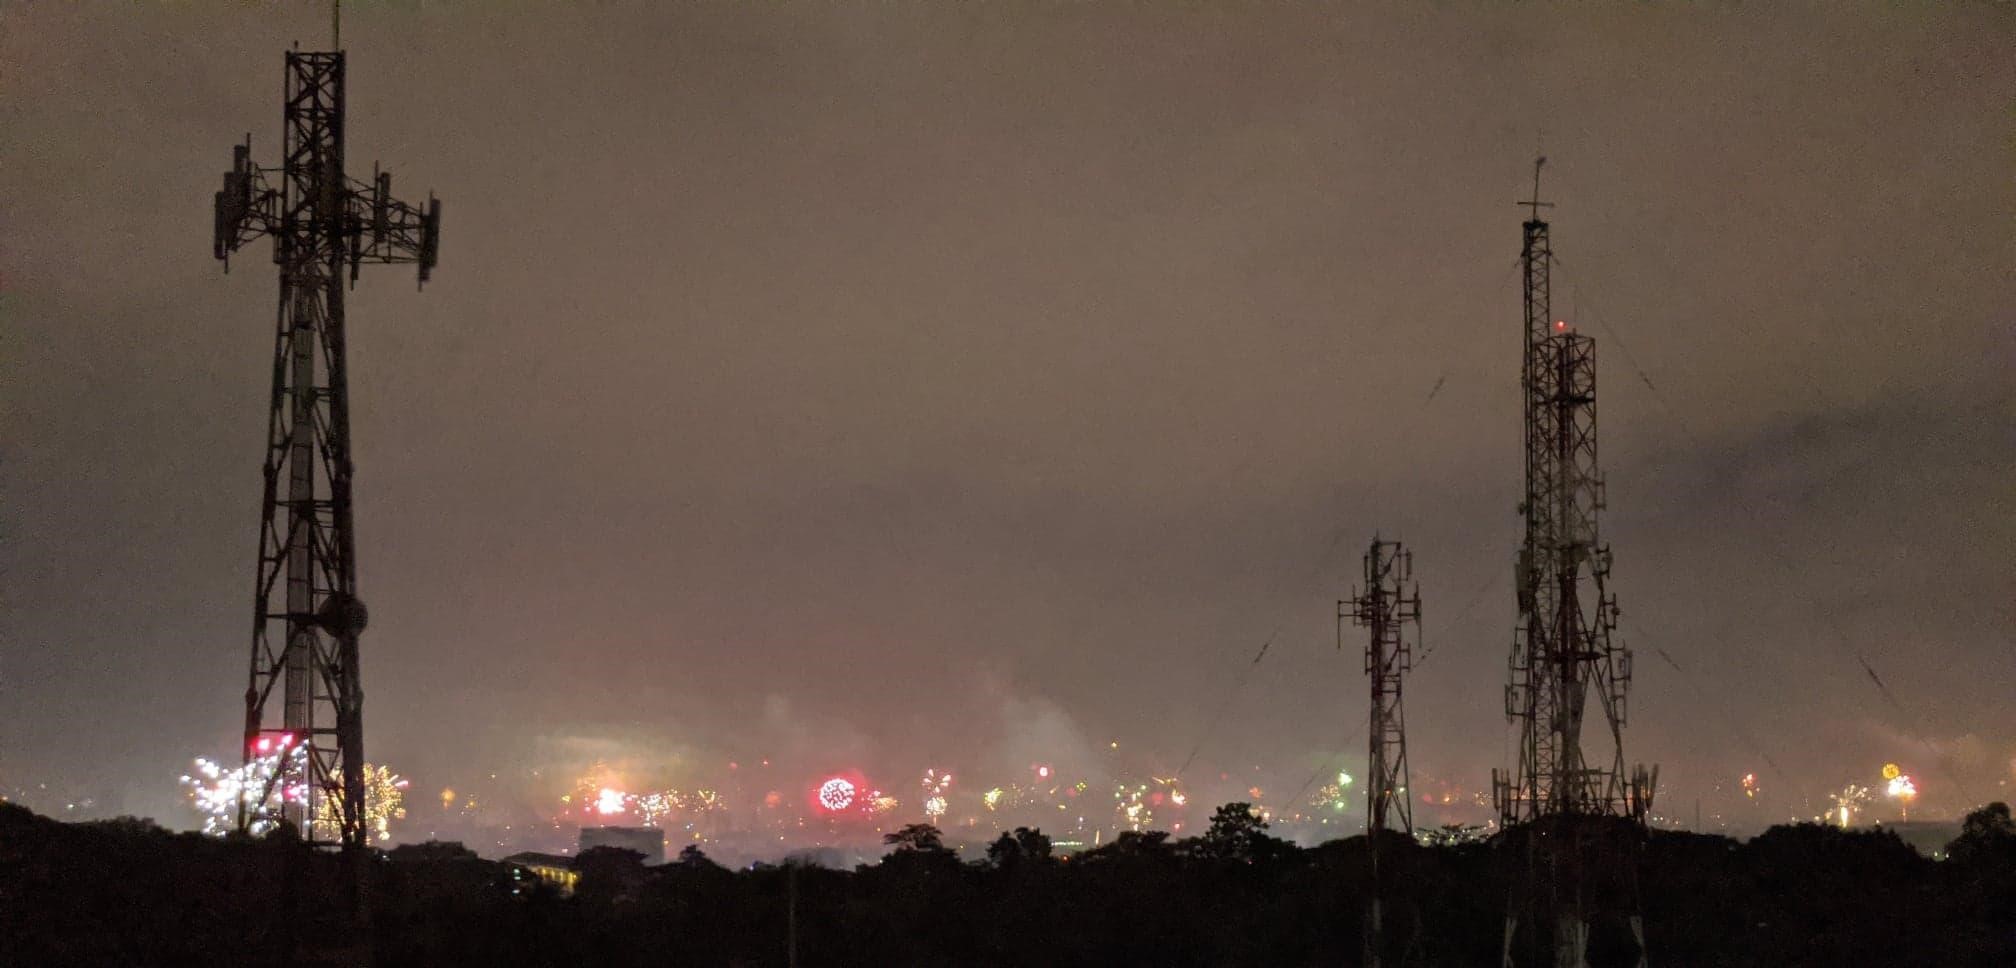
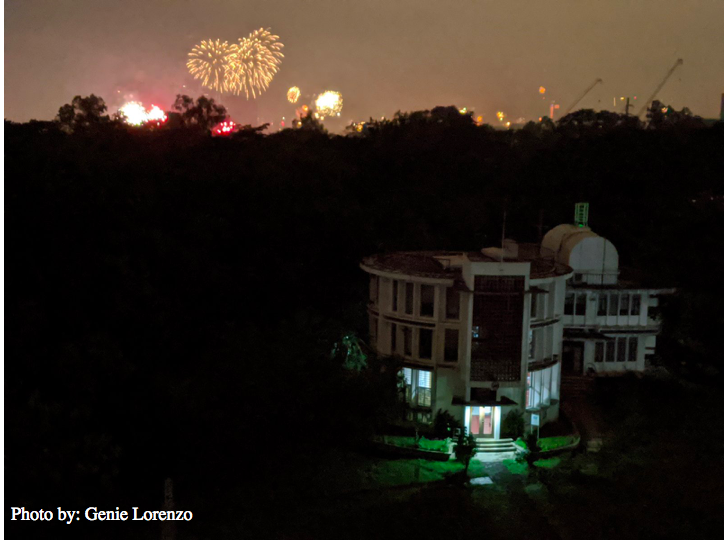
View from the Manila Observatory overlooking Marikina Valley during the 2020 New Year Festivities. Photo taken by Ms. Genie Lorenzo.
Appendix
Table 1. US EPA AQI for 24-hour PM2.5 concentrations.
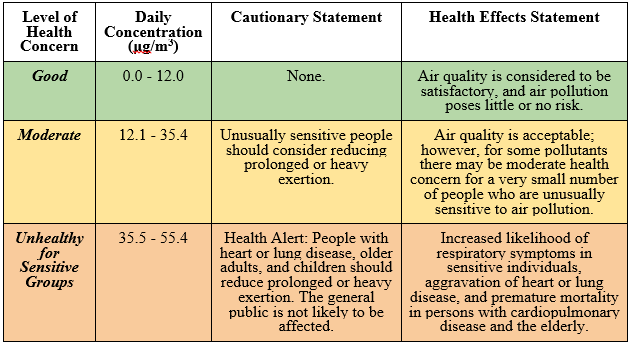
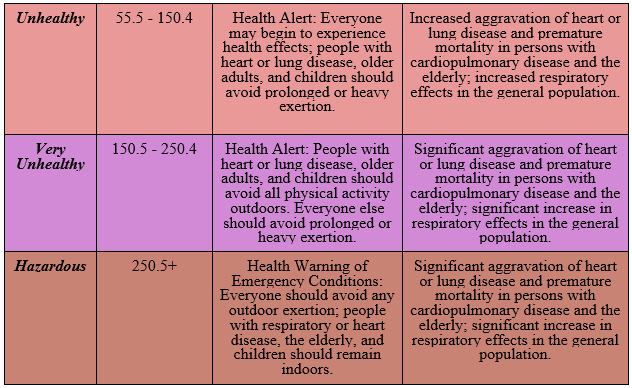
Table 2. US EPA AQI for hourly PM2.5 concentrations.
References
Ahrens, C.D. (2006). Meteorology Today (8th ed). USA: Brooks Cole.
Barman, S.C., Singh, R., Negi, M.P.S. and Bhargava, S.K. (2009). Fine Particles (PM2.5) in Ambient Air of Lucknow City due to Fireworks on Diwali Festival. J.Environ.Biol. 30: 625-632).
California Air Resources Board. (2020). Inhalable Particulate Matter and Health (PM2.5 and PM10). Retrieved from https://ww2.arb.ca.gov/resources/inhalable-particulate-matter-and-health
Chatterjee, A., Sarkar, C., Adak, A., Mukherjee, U., Ghosh, S.K., and Raha, S. (2013). Ambient Air Quality during Diwali Festival over Kolkata – A Mega-City in India. Aerosol and Air Quality Research, 13: 13: 1133-1144.
CNN. (2019). Duterte to order total ban on firecrackers. Retrieved from: https://cnnphilippines.com/news/2019/01/10/rodrigo-duterte-total-ban-firecrakers.html
Cruz, M. T., Banaga, P. A., Betito, G., Braun, R. A., Stahl, C., Aghdam, M. A., Cambaliza, M. O., Dadashazar, H., Hilario, M. R., Lorenzo, G. R., Ma, L., MacDonald, A. B., Pabroa, P. C., Yee, J. R., Simpas, J. B., & Sorooshian, A. (2019). Size-resolved composition and morphology of particulate matter during the southwest monsoon in Metro Manila, Philippines. Atmospheric Chemistry and Physics, 19(16), 10675-10696. doi:10.5194/acp-19-10675-2019.
Drewnick, F., Hings, S.S., Curtius, J., Eerdekens, G., and Williams, J. (2006). Measurement of fine particulate and gas-phase species during the New Year’s fireworks in Mainz, Germany. Atmospheric Environment 40: 4316-4327.
Greven, F., Vonk, J., Fischer, P., Duijm, F., Vink, N., Brunekreef, B. (2019). Air Pollution during New Year’s fireworks and daily mortality in the Netherlands. Nature Scientific Reports 9: 5735 (2019). Retrieved from https://doi.org/10.1038/s41598-019-42080-6
Kim, K.H., Kabir, E., and Kabir, S., 2015. A review on the human health impact of airborne particulate matter. Environment International, Vol. 74, pp. 136-143.
Maudlin, L.C., Wang, Z., Johnsson, H.H., and Sorooshian, A. (2015). Impact of wildfires on size-resolved aerosol composition at a coastal California site. Atmospheric Environment 119:59-68.
Retama, A., Neria-Hernandez A., Jaimes-Palomera, M., Rivera-Hernandez, O., Sanchez-Rodriguez, M., Lopez-Medina, A., and Velasco, E. (2019). Fireworks: A major source of inorganic and organic aerosols during Christmas and New Year in Mexico city. Atmospheric Environment: X 2(2019) 100013.